The Fed is selling trashury bonds to the pension funds, which are now deep underwater.

Pension funds buying as market cap increases, but the value of the bonds actually keeps dropping.

The Fed is selling trashury bonds to the pension funds, which are now deep underwater.
The next stage will be QT and rate cuts. Bond yields rising and fed funds rate dropping means uninversion of the yield curve. That is bullish gold.

Surprise!

Net liquidity is now controlling the stock market via the following formula:
Net liquidity = Fed Assets – Treasury General Account – Reverse Repo
When the Federal Reserve pivots, then you sell the USD.

The Federal Reserve is planning to hike rates until 3.5% by the end of this year.

Meanwhile GDP growth hits 0%.

Whenever the U.S. Treasury is out of cash in the Treasury General Account (TGA), additional cash will need to be borrowed by raising the debt limit and monetized by the Federal Reserve. This puts pressure on the U.S. dollar currency.
The Fed allows banks to buy back shares and issue dividends amounting to $128 billion from July 2021 onwards. Consider the following. A buyback uses cash on the balance sheet of a company to buy back shares, dissolving them and pushing the share price higher. That cash comes into the hands of shareholders and will start flowing into the economy. This in effect is a stimulus to the economy and pushes up asset and consumer prices.
The Reserve Balances at the Fed have been skyrocketing to $4 trillion. The higher this becomes, the higher the IOER needs to be. A hike in IOER is disinflationary as it incentivizes banks to hold more capital at the Fed (IOER serves as a proxy for the fed funds rate).
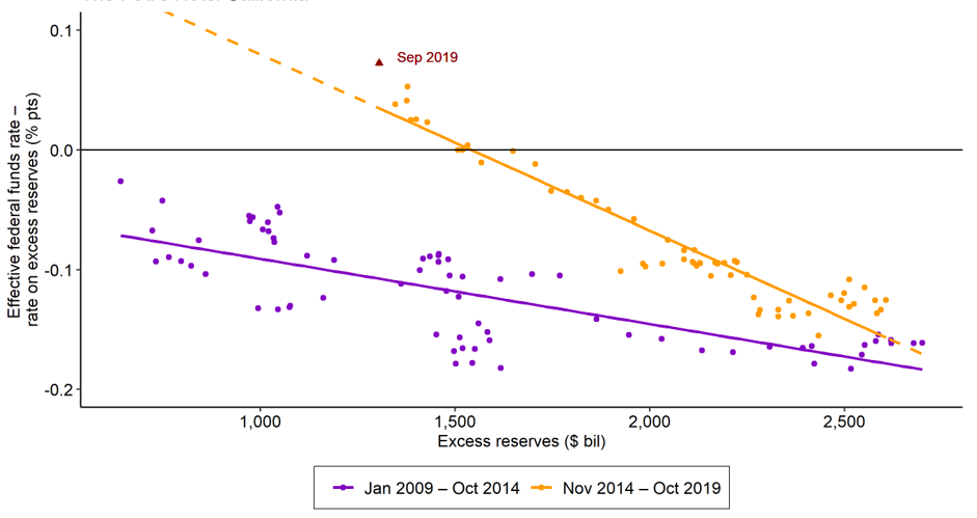
On the chart below we see that when the excess reserve balance goes higher, either the IOER needs to increase or the Fed Funds Rate needs to decrease.


