A Look At The Ministry of Finance Japan Draft 2016 Budget

One year has passed and Japan has not deteriorated as many analysts predicted. The Japanese stock market has gone up 10% since last year, the yen has been flat against the U.S. dollar, the Japanese housing market is rebounding, real GDP is at 1% and people who invested in the Japanese bond market didn’t lose any of their money.

I mentioned in a previous post last year that Japan’s situation wasn’t that bad at all. The current account was improving, the budget deficit was contained, bond yields were falling and I said that the benefits of the restart of the nuclear reactors was going to boost the economy of Japan. Well, two of the 48 nuclear reactors have been restarted and many more are going to be restarted as approvals are underway. With this in mind, let’s see how the fiscal situation will look like in 2016.

Go here for the analysis.

Decoupling Japan Vs. gold/stocks

On 9 November I started to write about the Japan carry trade versus gold.

Exactly at that moment, gold and the Japanese yen carry trade decoupled. Also stocks decoupled from the Japanese yen carry trade. Maybe they know we know and need to find something else to manipulate the markets.

Or we could be starting the hyperinflationary phase where the yen plunges and stocks don’t go up anymore, while gold does go up.

Correlation: Will Japan be able to keep gold steady in JPY in 2015?

Japan has upped the speed of money printing starting in 2013, just at the same time the U.S. did QE3. This has actually been keeping the USD and JPY exchange rate stable. But now when Japan announced QE infinity with triple the size of U.S. QE compared to their GDP, that stable exchange rate will start to deteriorate. Be aware that one must not look at the absolute size of QE, but needs to look at QE as a percentage of GDP. When a low GDP country prints the same amount of money as a large GDP country, its currency will depreciate much faster than the currency of the larger GDP country.

Another pretty stable exchange rate was gold compared to JPY. Since 2013 the gold price hasn’t done anything against the JPY. This means all of the printed money went into Japanese stocks instead of gold. I think the central banks have perfectly orchestrated it.

But what will happen when we have this regime change now? I think the gold price will definitively increase in Japanese JPY, that will be inevitable with this size of QE.

It will be interesting to watch what the U.S. will do next when they see all this deflation coming their way.

What’s even more interesting is that the Japan yen carry trade is so obvious now.

They borrow yen to use those yen to buy equities and short gold. The graph above shows this correlation between USD/JPY and gold, which I will add to our list of correlations. I suspect Japan wants to hold gold steady to show all is well and that there is no inflation. This carry trade cannot keep going on forever as it will blow up at some point. Physical supply and demand will eventually be the most logical conclusion. And the yen carry trade will only end when borrowing costs start to rise due to an increase in interest rates. So watch out for the rise in yields, which will prick the carry trade bubble. Another scenario could be that the Japanese debt is so unsustainable that we get a Greece situation where bond yields start to spike. And finally the ultimate scenario will be that the yield on the carry traded yen equals the yield on the U.S dollar, that’s the scenario where carry trading doesn’t work anymore as you need to have a difference in yield between the two currencies. We are already seeing this has happened in Germany, where yields are the same as in Japan. Which means no carry trade is possible for euro yen based on yield spread. And I’m pretty sure U.S. bond yields will be coming down as GDP growth slows down, so U.S. bond yields will be converging to Japanese bond yields as well, and that will be the end of it.

Waiting for the Plunge in Stock Markets

This is not going to end well I tell you. We are significantly overvalued at 123%. The question is: “When will it happen?”

I think it happens soon, because when we look at Japan, the GDP estimates there are now in negative territory. Japan second quarter GDP is forecasted to drop 10% year over year. That means the Nikkei will surely plummet and don’t even think this won’t affect the U.S. markets.

Japan GDP

Japan’s stock market is about to crash

If you want ideas which investment to make in the coming months, I would expect a decline in the Japanese stock market.

First, we note that the 10 year Japanese bond yield at 0.6% is pretty competitive against the dividend yields of Japanese stocks at 1.8% (Chart 1). So stocks aren’t such good value anymore compared to a year ago when dividend yields were at 2.8% compared to a 10 year treasury yield of 0.7%. Moreover, the P/E ratio of Japanese stocks is currently at 13, which isn’t particularly cheap.

Chart 1: Japan: Dividend yield Vs. Treasury Yield

Secondly, I have written extensively about the dire fiscal situation in Japan. Japan has a current account deficit, is printing money to stimulate their economy and more and more of its interest payments on Japanese debt is financed by less tax revenue. Obviously, this won’t be bullish for Japanese stocks.

But most importantly, recent numbers on the consumer confidence in Japan, point to a decline in the stock market for the coming months.

Read on here.

Japan Carry Trade

When you know your country (in this case Japan) is printing massive amounts of money and is debasing its currency, you can profit from this. You just borrow the debasing currency (yen) at ultra low yields and with that money you buy high yielding assets like the S&P500 or high yielding bonds in other countries.
So if the yen for example declines against the U.S. dollar (blue graph goes up), then you buy the S&P500 (red graph goes up). It also goes the other way round. When the yen starts increasing in value, people are going back into the yen to repay the borrowed currency by selling their high yielding assets.

During a few periods we don’t see a correlation because of other phenomenons like: NASDAQ bubble (2000), oversold equities (2009)…

Another example of carry trade is the U.S. debasing its currency with QE while emerging markets profit from this money printing. This carry trade is now unwinding as currency is flowing out of the emerging market currencies.

The key is: monitoring the USD/JPY exchange rate.

Euro surges against U.S. Dollar and Japanese Yen

As I predicted here and here, both the U.S. dollar and the Japanese yen are underperforming the euro. This is mainly because the central bank balance sheets of the U.S. and Japan are inflating, while the balance sheet of the Eurozone is shrinking/flatlined.

Central Bank Balance Sheet Expansion is Bad for the Currency

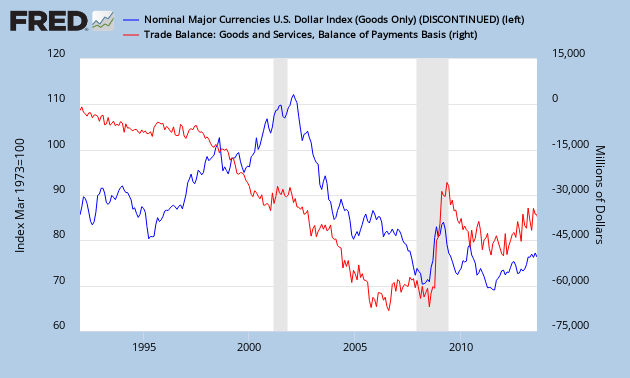
Moreover, we see that the Eurozone has a trade surplus while the U.S. and Japan have a trade deficit, which according to this correlation below, is good for the euro and bad for the U.S. dollar and Japanese yen.

Deficit is correlated to Currency Valuation

At this moment, if all things stay equal, the euro will continue its rise against the U.S. dollar and Japanese yen. An extra catalyst following the asset-quality review (AQR) is that the European banks need to increase capital next year and they will need to buy euros for that.

This also means that U.S. and Japanese bonds will continue their decline as following correlation between currency and bond yields suggests.

You see, this is the power of correlations… Maybe I should rename this blog to: “Correlation Economics”.

When will inflation in Japan show up?

People are wondering if the money printing experiment in Japan is actually going to be inflationary or not. As we all know, the inflation rate is measured by the CPI (consumer price index). If the CPI goes up, we have inflation.

The CPI of Japan consists of the items given in Chart 1. The items with the most weight in it are food, housing, transportation and fuel. Therefore, it is important to watch food and energy costs as well as housing prices in Japan.

Chart 1: Items in CPI of Japan (2010)

First, let’s look at food prices. Zero Hedge reports that McDonald’s has hiked the price of a burger in Japan by 20%. If we consider this price hike as a proxy for the overall food price in Japan, we could see a significant increase in the CPI coming.

Second, we take a look at the Japanese housing market. The Japanese housing market has always been in a decline for the last 15 years, but now we see signs of stabilization. Housing prices are about to rise in the coming years. In the metropolitan areas for example, we have seen land prices go up at an annual rate of 11.5% in 2012.

Third, fuel and energy costs are going through the roof. With the Fukushima disaster, a part of the nuclear energy had to be diverted to fuel. In fact, LNG imports soared to 86.9 million tonnes. Added to this disaster, the yen weakened considerably in 2013 which led to rising fuel and energy costs. We can witness this in the rising LNG prices in Japan. These events are a very good example of why a weaker yen is not a good thing, instead it creates an environment where people’s purchasing power declines. In this case the price of the imports of fuel are going up and this will add to the trade deficit of the country. The statistics bureau of Japan recently put out the latest numbers on the CPI. Fuel was contributing the most to the rising costs of living.

Table 1: Consumer Prices: Change from the Previous Year in 2012

So basically, we see that the 3 biggest components of the CPI are going up in Japan. It would surprise me if the CPI would decline in the coming months.

Continue reading here.