A recent article by Henry Bonner of Sprott Global Resource Investment caught my attention. In that article he mentioned Mishka Vom Dorp’s comments about money supply and inflation. One quote from Mishka is the following:
“First and foremost, an increase in the money supply does not directly result in inflation. In fact, the correlation between increases in M1 – money held by the general public – and inflation becomes apparent only when the timeframe is extended beyond a five year period. Over this longer time frame, the correlation becomes almost perfect.”
So I wanted to see for myself if what he says is true. I plotted the change in M1 against the change in CPI.
To my surprise the correlation is completely the opposite. We have a negative correlation here. Whenever the M1 growth increases (blue chart goes up), the CPI growth actually decreases (red chart goes down). The reason for this is probably that deflation is counteracted by the Federal Reserve by money printing and this causes M1 to increase during deflation.

What this means is that inflation will come when the money supply growth actually contracts. We’re in that period since 2012. So why is the red chart down since 2012? It’s because inflation has been visible in stocks, but stocks are not included in the CPI. But I believe we will see a flow from stocks to the consumer in 2014. Everything will normalize again to validate this (negative) correlation.
What Mishka says is true, there is indeed a delay between M1 and the CPI. By monitoring the change in M1, we can accurately predict the CPI. This is a very powerful tool indeed as this is a leading indicator. And as this correlation suggests, you should buy gold when the CPI goes up.
For the entire article, see below:
By Henry Bonner (hbonner@sprottglobal.com)
During a historic boom in equities, gold and gold equities have sunk to new lows with the GDX returning negative 55% over the past year. Why have gold and other precious metals fared poorly while other equities, such as those composing the S&P 500, have seen average annual returns of nearly 30%?
Mishka Vom Dorp, who joined Sprott Global Resource Investments Ltd. in 2008, explained why he believes precious metals have sunk – and where they are headed next.
“With government debt, unfunded liabilities and the money supply reaching all-time highs, surely the gold price should be increasing as well?
“The answer is, I believe, that in the short term, gold has not yet had time to react fundamentally. Whether you follow the official government CPI figures or alternative methods of computing inflation, we have yet to see the double digit inflation figures of the 70’s. There are two explanations that I believe are responsible for the lack of inflation that we see now but that we might see in the future.
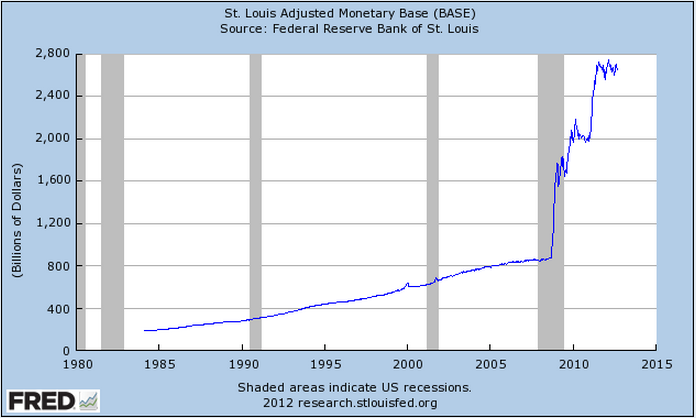
“First and foremost, an increase in the money supply does not directly result in inflation. In fact, the correlation between increases in M1 – money held by the general public – and inflation becomes apparent only when the timeframe is extended beyond a five year period. Over this longer time frame, the correlation becomes almost perfect.1
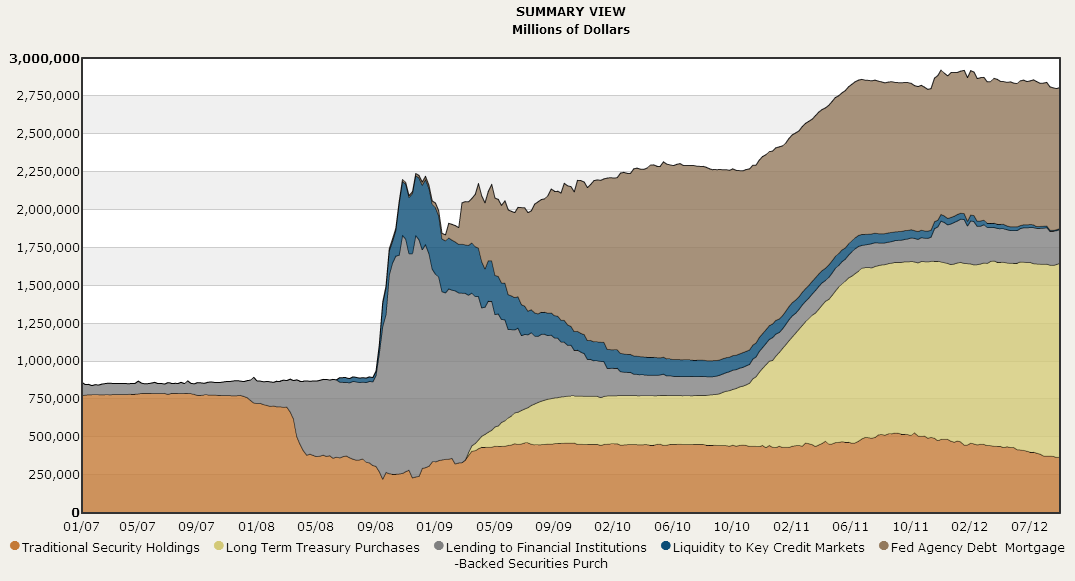
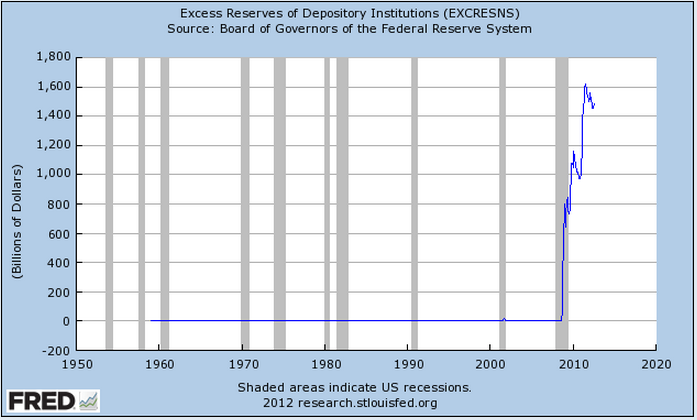
“Secondly, two thirds of the freshly printed greenbacks have not been released into circulation and are being held directly at the Fed in what are called ‘excess reserves.’2
“The Fed has, so far, incentivized banks to keep cash there instead of lending it out by paying interest on the reserves. Remember that the amount of un-lent capital held at the Fed is increasing on a year-to-year basis and rising interest rates would cause those reserves to snowball. The Fed will eventually have to cut interest payments on excess reserves, thus releasing a large amount of capital into the financial system, leading to inflation if not enough GDP growth is there to accommodate the influx of new dollars.”
So rising interest rates could bring current levels of excess reserves down and boost inflation if the economy fails to deliver sufficient growth. Inflation may therefore rear its ugly head after all… As Mishka concludes, now is not the time to dump gold and precious metals equities.
“With a dwindling supply of juniors, continuing write-downs on assets by majors, and a continuing of easy money policies, I believe we are close to finding the elusive bottom to this bear market.
“The longer the bear market, the stronger the bull. Investments in exploration and development of mineral deposits have fallen massively over the past three years. Mineral exploration is an extremely capital intensive business requiring billions of dollars in investments to find and develop large scale mines. With majors cutting their budgets across the board to bring down costs demanded by investors, it has been left to the juniors to ensure discoveries are made to meet current and future demand.
“Now that only a handful of competing resource investors are still around, we will have the ability to research, finance and invest in what we believe are the best companies without the need compete with an eager market.
“I would be devastated to have sat through this bear market this far with you only to have missed out when the picture finally shifted in our favor.”