ETF
Status on top holdings of exchange traded funds backed by physical gold
Once in a while I check up on the global ETF’s backed by physical gold. As I could have guessed, the ETF’s are taking in more gold. In February the sum of the largest ETF’s stood at 1676 tonnes physical, while GLD stood at 773 tonnes.

GLD gold holdings Vs. Top gold ETF holdings
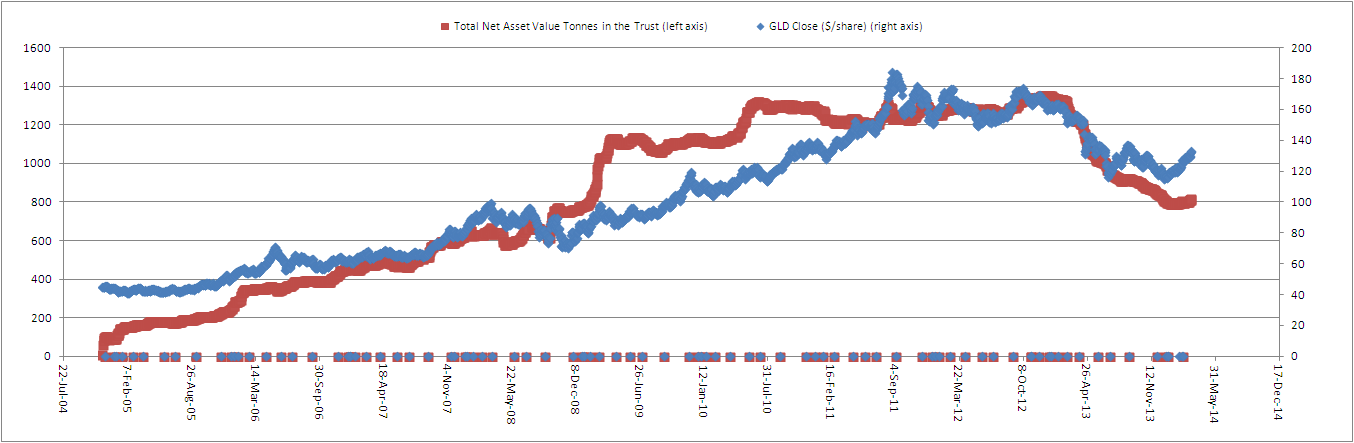
A few weeks ago I searched up some data on the GLD tonnes of gold in their trust Vs. Total gold ETF holdings and we saw an obvious correlation. I’ll update this page once in a while to see where we are headed to.

Whenever GLD gold holdings go up, the holdings of exchange traded funds backed by physical gold go up.
GLD used to take up 70% of the total gold ETF holdings in 2008, but today it only adds up to about 40% share of the total gold ETF holdings.

Run on GLD Starting at Decade Low GOFO Rates
It is very odd that Shanghai demand is now receding.


Today the SGE withdrawals of gold fell again 16% from last week to only 21.4615 tonnes, see chart below courtesy of Koos Jansen: In gold we trust. So demand for gold in China is really dropping fast as premiums between China and London are still at zero, indicating that demand for gold from China is very unnaturally low.

However, the GLD ETF had something interesting to tell. The GLD physical stock finally started dropping hard since yesterday, while I had thought it would start increasing.

GOFO rates are now very negative historically hitting new lows. Maybe this tells us that GLD is finally having a run on gold due to supply tightness. Because China isn’t buying, so who is actually taking delivery from GLD now? Maybe the retail investors themselves, demanding for the physical. I’m just guessing around, could also just be storage fee payments.
Correlation between GLD ETF and COMEX
This is why I think the gold price is bottoming out, we have additional evidence at the COMEX.


When gold started its decline in April 2013, the COMEX registered stock level kept dropping due to outflows. This event was building up stress in the gold market as the gold price dropped.
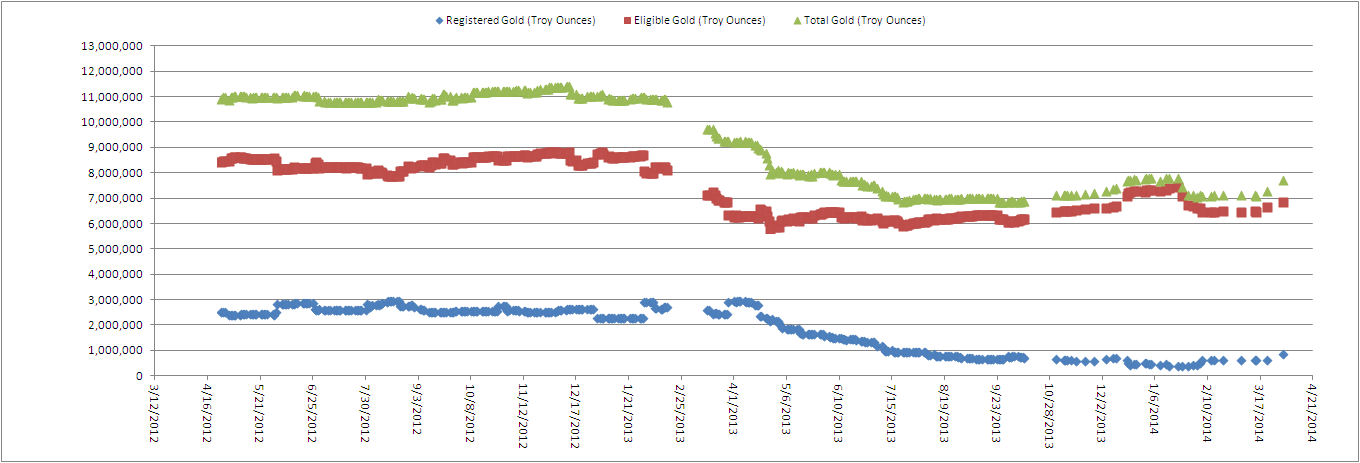
The same has happened with the GLD ETF. So this is very interesting, it means that the GLD ETF and the COMEX gold stocks are correlated, which I didn’t even notice up until now.

Since January 2014 both the COMEX and the GLD ETF bottomed out and started taking in physical gold stock. This made the price of gold go up more than 10% to date. You can see on the first chart that the registered gold stock at the COMEX is even increasing as we speak. This is a bullish indicator as this means that the GLD ETF gold stock level will increase too (if my correlation theory is correct). And everyone knows that when GLD takes in physical gold, that this is real physical demand pushing prices upwards.
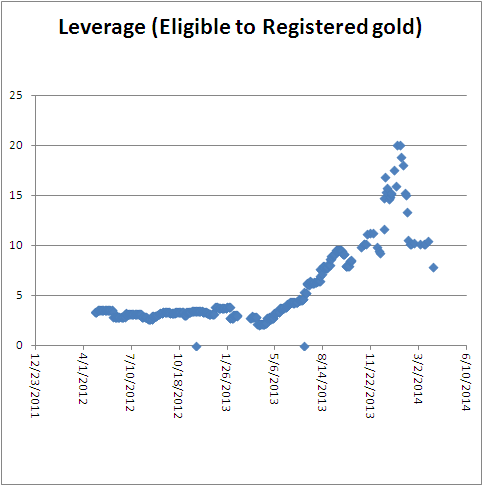
Leverage has come down significantly due to the increase in registered gold at the COMEX. A further deleveraging should be bullish for gold.
By the way, gold should be much higher tomorrow as we start the new quarter. They tried to push the gold price down and stocks higher at the end of this quarter to make their books look good.
India Set to Import Twice as Much Gold
It begins. This week, India allowed 5 private sector banks to import gold. The Reserve Bank of India (RBI) has allowed gold imports by HDFC Bank (HDBK.NS), Axis Bank (AXBK.NS), Kotak Mahindra Bank (KTKM.NS), IndusInd Bank (INBK.NS) and Yes Bank (YESB.NS), officials at the respective banks told Reuters.
This is major news because this will double the amount of gold imports to India from the current level.
As you know, Indian gold imports were flat in 2013 due to the tax imposed on gold imports in August 2013. Imports have been sharply down more than 50% ever since. But now that these 5 Indian banks are allowed to import gold, we expect the Indian gold import number to double again to its previous levels.
 |
| Indian Gold Imports |
 |
| Monthly India Gold Trade (Koos Jansen: In Gold We Trust) |
Premiums have soared to more than 20%. But I expect these premiums to come back down to the 10% level as imports double from the current level.
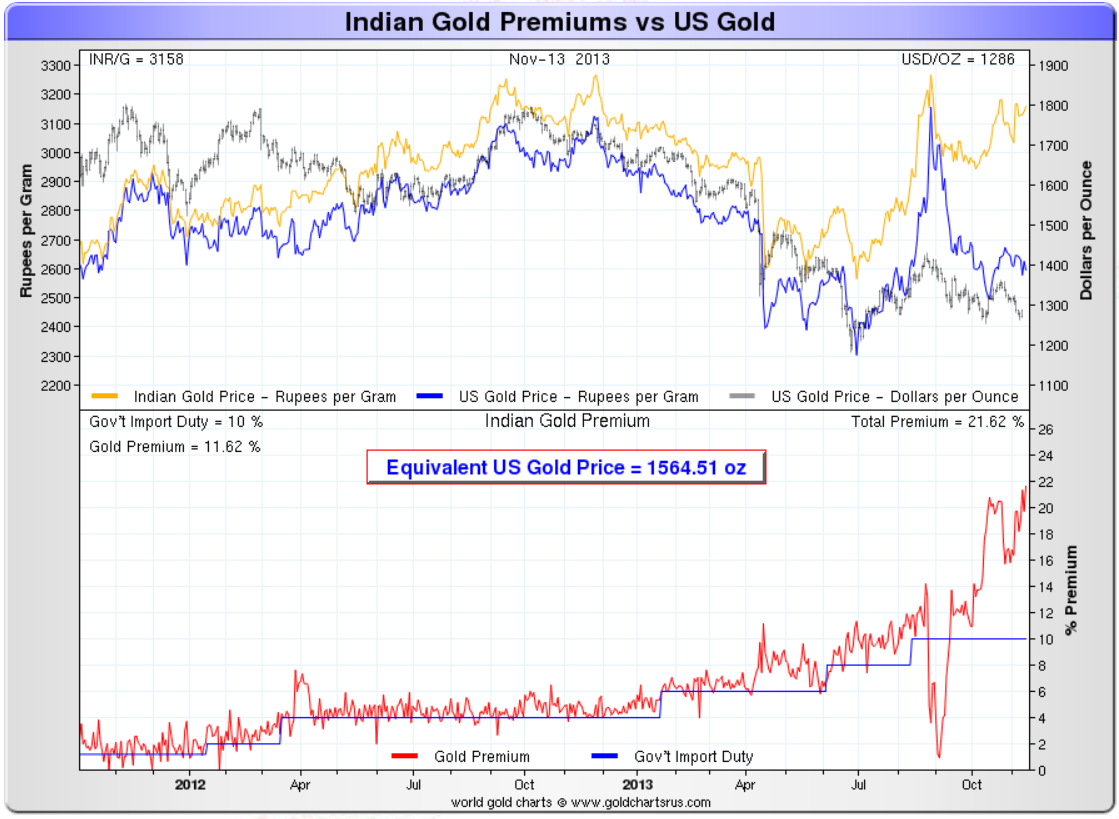 |
| India Gold Premium |
Will India become the largest gold importer once again? Read on here.
Gold ETF Funds Start to Buy Gold
If you haven’t noticed yet, the Gold ETF (GLD) has seen an inflow since the bottom in the gold price. So basically the supply of physical gold going out of GLD is now turning into a demand for physical gold going into GLD.
This will be a bullish event for the gold price.
Although Western people are now buying physical gold once again, the Chinese have backed off in buying as the premiums in Shanghai are now 0%.
So the East and the West keep each other in balance…
GLD ETF Raid Slowing Down
The ETF outflows keep progressing, but this time at a slower pace. Half the pace we saw begin 2013. This should at least support gold prices going forward.
 |
| Chart 1 |
The most obvious reason is because of the low premiums in China (Chart 2). There is no arbitrage opportunity anymore today, while in May 2013 we had a higher premium in China. So at that time they could take delivery on GLD and sell it to the Chinese. Today it’s more difficult.
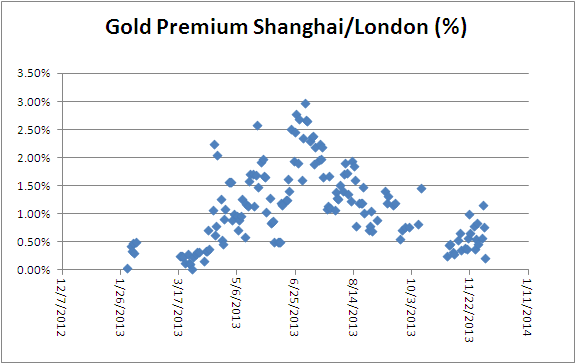 |
| Chart 2 |
So why do we still see these ETF outflows in GLD? We have these bears in the gold market that are responsible for this. Most ETF’s are loss-making due to the declining gold price and fuel the ETF outflows. But now that the gold price kind of stabilized at $1200/ounce, we should see a stable ETF stock going forward. We also see that shorts are covering, which is also stabilizing the ETF outflows. The key is China buying increasing amounts of physical gold and that should support prices. There is no way that the ETF outflows can continue, because China will keep buying more and more gold. The ETF’s will start buying gold if the gold price bottoms out.
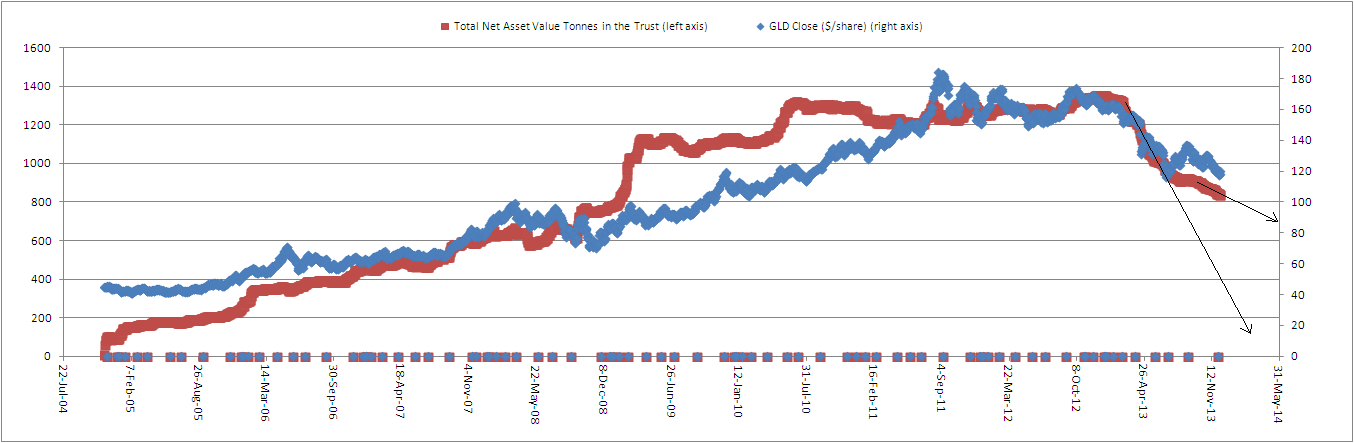
Correlation: Monitoring the GLD Trust ETF to Predict Gold Prices Based on Demand
As demand is now being dictated for a part by the ETF’s, we need to pay attention to what is happening in the trusts. Are they unloading their gold? Because if they keep unloading their gold, the demand from ETF’s is going to decline, which has a negative impact on the gold price. This is the theory of supply and demand.
You can monitor this chart daily at the SPDR gold trust site:
http://www.spdrgoldshares.com/usa/historical-data/
| Chart 1: GLD Trust: Units in the trust (tonnes) |
As I indicated here, ETF’s were the largest sellers in gold, resulting in a 13% decline in the demand for gold. I cannot stress how important it is that ETF’s keep buying gold. If they don’t buy, like what happened starting in 2013, then the price of gold will decline. The great difference between 2013 and 2008 is that in 2008, ETF’s were massive buyers of gold, while today they are massive sellers. Keep watching this trend. If it reverses, you can confidently start buying precious metals
The Great Disconnect in the Paper and Physical Precious Metals Market
Over the last few months, precious metals investors have seen their net worth decline due to declining precious metals prices (GLD), (SLV). A lot of this decline in precious metals prices was due to a decrease in demand, which was the result of selling by hedge funds as the World Gold Council reported here.
First quarter gold demand of 963 tonnes was down 13% compared with Q1 2012 due to an outflow in the total gold ETF holdings of 177 tonnes. 2013 marks the first year in a decade where ETF’s are actually selling gold. While ETF holdings were reduced, this selling has been countered by an increase in physical demand for gold by China and India. Total demand in China rose 20% to 294 tonnes in Q1 2013 as compared to Q1 2012 (50 tonnes increase).
This huge increase in demand for physical gold can be witnessed on Chart 1, which gives the net imports of gold from Hong Kong to China.
 |
While Chinese demand for gold was strong, Indian demand increased at an even higher pace. The Indian demand for gold increased 27% on the same quarter last year to 257 tonnes.
On the supply side we see a total increase of 1% in the first quarter of 2013 as compared to Q1 2012. Mine production increased 4% while recycling of gold decreased 4%.
|
(click to enlarge)
 |
So, the reason for the decline in precious metals prices is evident from an increase in supply (mine production increased) and a decrease in demand for gold (ETF outflows) (Chart 2). But there is an important point I need to make here. While the supply side is pretty constant at 1% increase, the demand side is the critical indicator we need to look at with its 13% decline. The decline was a result of hedge funds converting their gold holdings into equities. The Dow Jones (DIA) hit an all time high last week, fueled by a bullish prospect in the equity market of Japan, which on itself was a result of the massive Japanese monetary stimulus announced in April 2013. Although investors are cheering the bull market in equities, the macroeconomic conditions keep worsening. A few examples were a deterioration in PMI, capacity utilization, ISM manufacturing, vehicle sales, ADP employment, initial claims, PPI, mortgage applications, wages.
To see what this means for gold, read on here.
