LCNS net short positions Vs. Open Interest

I haven’t looked at this possible correlation yet, but thanks to “goldbug” who reminded me here, I just decided to take a look at this possible correlation.

Apparently, they do correlate. When open interest skyrockets it’s mostly because of the increased net short position of large commercials.

That makes life simpler, you just have to look at the open interest which is given each week on the ‘GotGoldReport‘ site, and you will automatically know whether net short positions went up or not.

If open interest is high, you can be sure that silver will sell off.

Chart 1: Open Interest Silver
Chart 2: LCNS Net Short Positions Silver

The Current Status on Precious Metals

Let’s do a quick analysis on precious metals here.
First off, I said yesterday that China lost interest in gold during the past months in this article.

Second, we were expecting a drop in net shorters for silver when we saw a drop in the silver price, but this didn’t happen.

LCNS went back up, so that means there are still a lot of people with interest to get the silver price down.
Chart 1: LCNS Silver Net Short Positions

Third, the declining lease rates are also indicating that weaker prices are still to come.

Chart 2: Silver Lease Rates

Fourth, the silver stock at the COMEX has been rising, which indicates to me a further decline in prices is probable.

Chart 3: COMEX silver stock

Another indicator at the Sprott PSLV says that premiums have been dropping. This drop also indicates a disinterest in silver.

Chart 4: Sprott PSLV premium

And finally, we saw that since September 2012, the gold and silver miners have been greatly underperforming the gold and silver price, which indicates further weakness in precious metals to come.

Chart 5: Gold Miners Vs. Gold Price

I have to say, I’m not that bullish on precious metals at this moment when I see all these indicators going downwards.

Silver/Gold LCNS update

So far so good for the trend in LCNS for August 2012. As I mentioned before here and here, the LCNS is a leading indicator for the silver price. Once you see the LCNS go up, the silver price will go up a few weeks after it.

In an email update from Peter Schiff last week, he mentioned that silver would be the best commodity to buy these days. I agree, there is a very good chance that silver will blast through the resistance of $38/ounce.

Don’t wait for a pullback.

Chart 1: LCNS Silver positions
Chart 2: Silver Price

As for gold we see the same happening (September 18th, 2012). LCNS is spiking upwards, so there is a good chance we will see gold higher the next few weeks. Once you see the LCNS go down, you start to see a pullback. I believe though, that the LCNS has already bottomed out and will continue higher.

Chart 3: LCNS Gold positions
Chart 4: Gold Price

Predictions all Came True!

Just a little pat on my own back.

QE3 was announced on 13-14 September 2012, it was predicted that they would by MBS and bonds, Eric Sprott premiums on silver went up, bond yields went up, LCNS went up, silver broke out.

All predicted in this August 2012 article.

Now the only thing that remains is the JPM silver manipulation. That will ultimately happen when physical shortages in silver start to emerge and we already see that happening. So brace yourself for a spike in silver!

See Kingworldnews: Mounting shortages in gold and silver.

Update on Silver Net Short Positions: LCNS

On Monday 6th of August, the Financial Times leaked the news that the silver manipulation probe is likely to be dropped by the CFTC. It turned out that this news was premature. One of the 5 CFTC commissioners, Bart Chilton, said on 08 August 2012 that the investigation will continue as silver manipulation did occur. The silver manipulation probe was initiated in 2008 following a number of allegation of silver manipulation. Bart Chilton already found evidence of silver manipulation in 2010 and intends to search for additional evidence of this manipulation of the silver price.

How this all connects to the CFTC’s LCNS numbers of July 2012, you can find out here.

The Status on Silver

This article is a summary on the most recent developments in the silver market. I will talk about the silver technicals, silver-gold ratio, silver investment, silver depletion, silver long/short positions and silver warehouse stock.

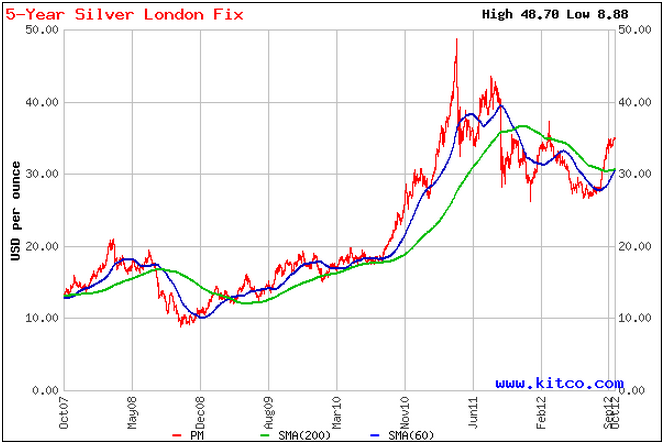
Let’s start with the technicals. A pretty concerning picture for silver can be witnessed on the gold-silver ratio chart (Chart 1). You can see that in mid 2010, silver started to outperform gold until mid 2011. During that period, silver went from $US 18/ounce to $US 50/ounce (Chart 2). But recently, the silver price underperformed the gold price, with the gold-silver ratio going back to 60.

Chart 1: Gold – Silver Ratio
Chart 2: Silver Price

However, based on historical gold-silver ratios, we could go back to a 16:1 ratio as the trend in the gold-silver ratio is downwards (chart 3). We already had a second peak in 1992 at gold-silver ratio of 94 and we will go back to the low of 16.

Chart 3: Long Term Gold – Silver Ratio

Last year, silver had been doing well, going to $US 50/ounce and a gold-silver ratio of 30. Recently, we saw a correction in the gold-silver ratio back to 60. I believe that correction is over and many other investors including Eric Sprott acknowledge this. We’re approaching a key technical point of a wedge pattern. Either we’ll get a huge move to the upside or we get a huge move to the downside. I believe we’ll see upside and we already see evidence of this. Just recently, the Sprott Physical Silver Trust priced in a follow-on offering of silver trust units in an amount of $US 200 million.

The fundamentals of silver are getting better and better every day. Concerning the depletion of silver, the New Scientist forecasted in 2005 that silver would be depleted in about 15-20 years. This means today we have only 10 years of silver left. Unlike gold, silver is being consumed as it is used in many applications. After consumption, the silver will be thrown together with its applications into land fills and will never be recovered. You could argue that silver can be recycled, but studies have shown that the recycling of silver is not feasible below a price of $US 50/ounce.

Silver scrap is a very important factor in supplying the silver to the markets because it comprises 22% of total silver supply. Since year 2000, the silver scrap to silver supply ratio has been steadily declining. Only just recently in 2011 we saw a spike in the silver scrap to silver supply ratio to 24.7% (Chart 4). This spike is due to the record high price of silver in 2011 ($US 50/ounce), which spurred investors to recycle jewelry and silverware. I expect this number to come down in 2012 as the silver price has been correcting.

Chart 4: Silver Scrap to Silver Supply ratio
Events like the offering of the Sprott Physical Silver Trust add to the velocity of depletion as investment demand will take silver supply out of the market. Manipulation of bullion banks to decrease the silver price only adds to the demand of investors to buy silver. We see this in the Silver Institute’s 2011 report on silver demand/supply. The demand for silver coins went up an astonishing 18%.
On the net short positions of silver I want to make clear to investors that we are approaching a decade low in the Large Commercial Net Short positions (LCNS). Historically, when LCNS goes up, the price of silver goes with it. Basically this means that a huge spike to the upside is imminent.
Chart 5: LCNS silver
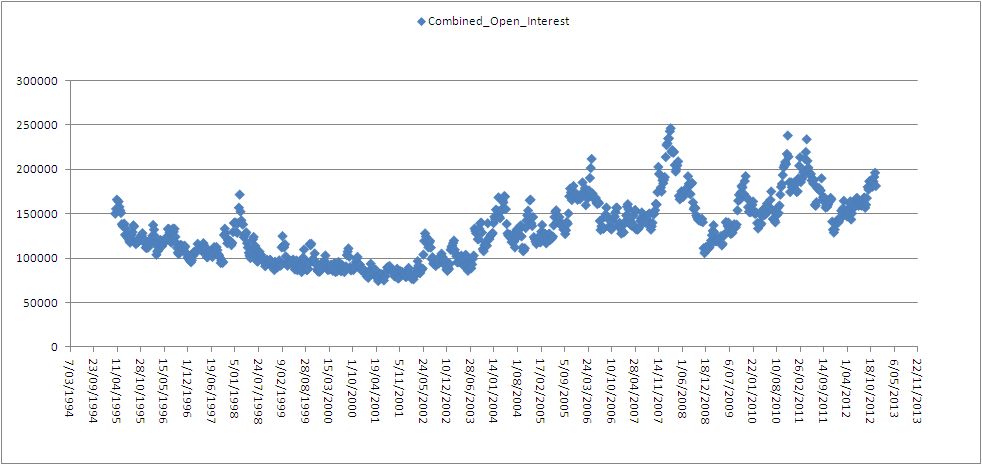
On the COMEX silver front we note that registered silver went up from 29.0 million troy ounce (25 April 2012) to 38.7 million troy ounce today, indicating that physical silver has been stocked in COMEX warehouses. Total silver inventories rose from 140.6 million troy ounces (25 April 2012) to 144.4 million troy ounces today (Chart 6). Rising stocks typically mean that there is less demand for silver, declining stocks typically mean there is more demand for silver. On chart 6 we see that stocks had been slowly rising in the previous months (less demand), but more recently, the stock has been declining again since the start of July 2012. Demand is picking up again due to seasonal strength in precious metals (month of July).
Chart 6: COMEX silver stock
On the more fundamental side of the economy we noted a very interesting event in the deposit facility of the ECB. Overnight deposits declined by more than half due to the ECB deposit rate cut. This 500 billion euro will basically find its way somewhere, possibly in the precious metals market.
Conclusion: It should be a very good time to invest in silver.

Silver Net Short Positions Hit Record Low Again

In my previous article about net short silver positions I said that silver would explode upwards once the net silver short positions started to increase.

Today the June 2012 numbers came out and we see that the net short positions have not gone in an uptrend yet. 
So we wait…, until the spring suddenly unwinds.

LCNS Net Short Positions Silver
Chart 1: LCNS Net Short Positions in Silver

Data: http://www.cftc.gov/OCE/WEB/data.htm

Silver Net Short Positions Lowest in a Decade

Today, as I navigated on GoldMoney’s website, I learned a little bit about swaps and net short positions in silver. So I searched for keywords like swap and net short position and came to a very interesting website named Gotgoldreport.com. I wanted to summarize in short what I read there.

Apparently physical silver is headed higher and this can be deducted by the net long swaps, which are at their highest point from at least 2006 onwards. You can see that in September 2007, the silver price shot upwards from $US 13/ounce to $US 20/ounce when the swaps position declined. The same happened in 2009. Now the same will happen in 2012: when swaps (blue line) goes back down, you need to prepare yourself for a move upwards in the silver price.

Chart 1: Swap Dealer Net Position Silver
The second indicator is the net short position of the large commercials (LCNS) (Chart 2). Blue line is the LCNS, pink line is the silver price. There has never been so few net short positions in the commercial traders in a decade. And each time when there is a low in net short positions (September 2005, September 2007, October 2008 and now), the silver price would spike upwards with a delay of a few months. We haven’t seen this spike upwards yet, because the net short positions are still declining, but once the blue chart reverses upwards, you can brace yourself for the biggest run upwards in silver ever.

Chart 2: Large Commercial Nets Short Position

Go to this site to get access to the long/short positions:
Here is the excel file: http://www.cftc.gov/OCE/WEB/Report%20Data/COT_Data.xls

I compiled the data myself by subtracting the long positions from the short positions and I came up with chart 3. This basically means that commercials were always net short silver throughout history. And this longer term Chart 3 also confirms that net short positions are the lowest in a decade.

Chart 3: Net Short Positions (LCNS)