This week, we have seen one of the largest dumps in the gold price (NYSEARCA:
GLD). I can believe that many precious metals investors are a bit worried here, so let’s give a damage report analysis on the current status and see how we are going forward from here.
First of all, the weakness in gold price is only found in U.S. dollars.

If we measure the gold price in euro terms, we get an entirely different picture. The gold price has actually soared in euro terms due to the announcement of quantitative easing by the ECB. The same goes for Russia, Ukraine, Japan, Australia, Canada, Norway, Brazil.

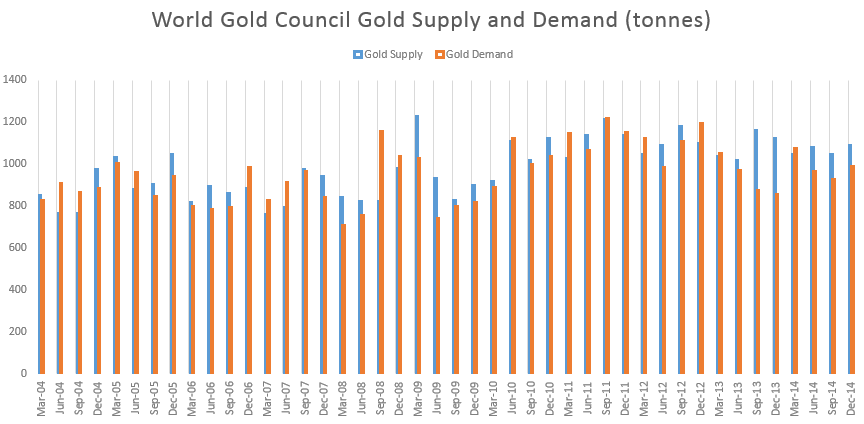
If we take the latest demand and supply numbers from the World Gold Council, we get the following picture (chart created by Correlation Economics).
(click to enlarge)
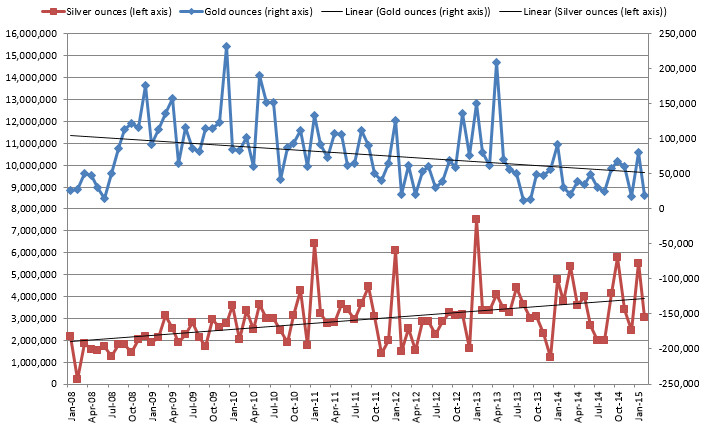
Gold demand has been showing strength since last year. Demand from India will be subdued. Many had hoped that India would be cutting the import tax on gold from 10% to 2%, but last week it was announced that the government would keep the tax at 10%. This decision has certainly contributed to the decline in gold price. Demand from China has been very strong, due to the Lunar New Year. Demand from the U.S. on the other hand is slowing down. When we look at the U.S. mint sales (which are a proxy for coin and bar demand) we see a significant weakness in gold, but strength in silver (chart created by Correlation Economics).
(click to enlarge)
One interesting event on the demand side is coming from Apple (NASDAQ:AAPL). Starting from April 2015, Apple will start producing the Apple watch. This will add another 15 tonnes per week of gold demand, which is very significant. This is one third of global gold supply.
On the gold supply side, we see that the trend is going down. Lower gold prices will lead to a delay in many mining projects as their internal rate of returns go to the single digits. Even though gold production has been pretty steady (and even rising to an 11 year high in Australia) due to the switch to high grade ore bodies, these ore bodies will become depleted and this will shorten mine life tremendously going forward.
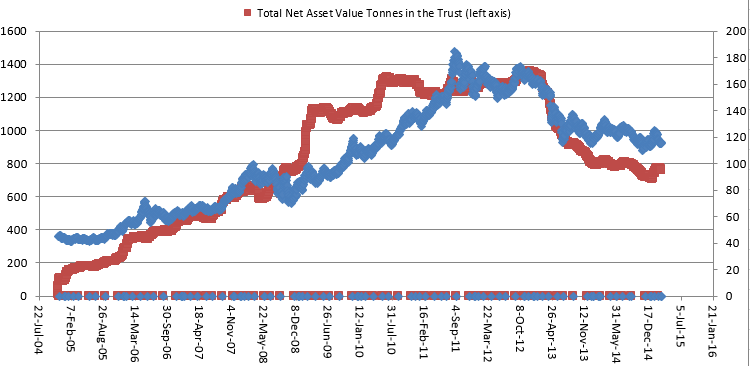
Gold supply coming from GLD (which contributed to the gold price decline in 2013) has completely reversed this year (chart created by Correlation Economics).
(click to enlarge)
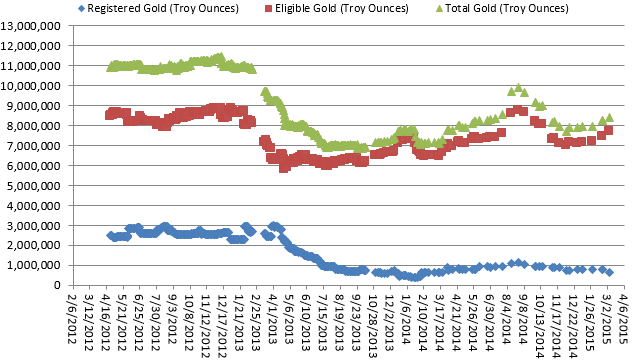
I believe we won’t see anything like 2013 again because there is no physical gold left. When we look at the COMEX registered gold stock level (which is equivalent to allocated physical gold), we see that we are still at record lows (see blue chart) (chart created by Correlation Economics).
(click to enlarge)
In fact, the ratio of eligible gold against registered gold is now spiking as we speak. We currently have a leverage of 12 to 1. This is pure evidence of paper gold manipulation and tells me that we are very close to a bottom in gold. Remember the first spike in leverage in January 2014? That coincided with a bottom in gold. We are seeing the same thing today all over again (chart created by Correlation Economics). More so, this might set off an LBMA default.

The evidence of an imminent LBMA default comes from HSBC (custodian of GLD) itself, which is closing all its 7 gold vaults in London. This indicates there just isn’t any physical gold left and follows up on the other fact that the LBMA doesn’t report gold lease rates anymore since February 2015.
Conclusion: Although we are still in oversupply, I believe we will be moving into a deficit next year. Now let’s move on to the analysis on premiums.
The recent smash in gold has had a significant effect on the precious metals premiums. All premiums have been trending higher and this means physical gold and silver is getting harder to get.
Miners have kept their selling price steady, which resulted in a premium of around 25% for silver (chart created by Correlation Economics).

APMEX silver premiums have gone higher again at 28% (chart created by Correlation Economics).

APMEX gold premiums are higher at 3.6% (chart created by Correlation Economics).

Shanghai silver premium to London spot price is trending higher (chart created by Correlation Economics).

Shanghai gold premium to London spot price is holding steady, but ready to rise (chart created by Correlation Economics).

Finally, let’s take a look at the Commitment of Traders report to predict the short term outlook. The managed money short positions have been going up since the start of the year while the large commercials have covered their shorts in the process. I expect that we will see a bottom in gold in about two to three weeks based on this chart (chart created by Correlation Economics).

Silver on the other hand looks much weaker here, I would avoid silver at this time (chart created by Correlation Economics).

And on a final note, central banks are now quietly repatriating their gold reserves from the Federal Reserve Bank of New York, I suggest you do the same. Because gold repatriation (cfr. 2001 and 2008) always coincides with a looming recession (chart created by Correlation Economics).

Overall conclusion:
Gold hasn’t been doing that bad since the start of 2015 when we look at it globally. I believe the demand and supply numbers are favourable going forward. A lot of the decline in gold has been attributed to the paper gold manipulation as we have evidenced from the COMEX action. Premiums have been trending higher, indicating shortages in precious metals. Based on the COT reports we could see a bottom in about 2 to 3 weeks.


