Correlation: Buybacks Vs. S&P

Buybacks are the hot item in 2014. Share repurchases happen when companies have a lot of cash. They buy up the company’s shares with that excess cash and then destroy the shares. The amount of shares go down, the earnings stay the same. The earnings per share go up, so the share price will go up.

The correlation below shows that relationship between buybacks and share price.

Today (2014), almost 90% of all S&P companies are buying back stock. But when we look at it on a market cap basis, buybacks are decreasing, which will mark a top in the stock market. When the stock market finally goes down, liquidity will be a problem as companies have spent all their cash.


Consumer Sentiment Index Vs. S&P 500

There is a correlation between consumer sentiment and the forward P/E ratio on the S&P 500. Investors will be willing to pay increasing multiples if they are confident that the future streams of earnings are sustainable and forecastable.

If we know that forward earnings are a measure of how confident investors are to buy stocks compared to the earnings of the stocks, then we know that the forward P/E ratio is correlated to the S&P 500 itself. By deduction, the consumer sentiment index is correlated to the S&P 500.

The consumer index (blue chart) is a leading indicator for economic trends so if we see a drop in the blue chart, the red chart (S&P 500) will go down a few months later.

Consumer Sentiment Vs. S&P 500

Initial Jobless Claims starting to rise, S&P in for a correction

This week’s initial jobless claims were rising again as reported by Zero Hedge and based on the obvious correlation between the S&P and initial jobless claims here, I expect that the S&P will come down eventually.

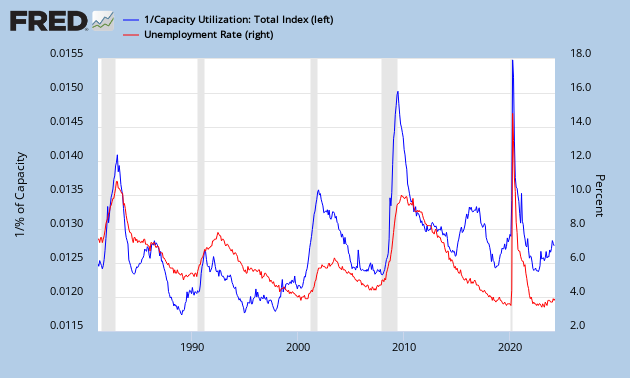
On top of that, the capacity utilization for the previous month was edging down (blue chart going up), which confirms that the unemployment rate will start going upwards (red chart going up).
 While deflation sets in with a lower CPI (red chart going down).

Correlation: S&P Revenues Vs. PMI

Dr. Ed Yardeni’s blog is a pool full of critical information and one of them is a newly discovered correlation which I will add to my collection.

Apparently the PMI is a leading indicator for the S&P revenues, which also means the PMI is a leading indicator for the overall direction of the stock market. This is consistent with the correlation between the PMI and the GDP, which is correlated to the total stock market index on itself via the Warren Buffet Rule.
So if you want to know the direction of the earnings of the financials, just look at the PMI and you can predict the trend, which is certainly down after the miss in PMI reported the previous week.

Chart 1: S&P 500 Revenues Vs. PMI

Durable Goods Orders Vs. S&P

This page is created to monitor the Durable Goods Orders Vs. S&P.

The durable goods orders are new orders placed with domestic manufacturers for delivery of factory hard goods.

If we see a plunge in durable goods orders (blue chart), we know for sure that in the months to come we won’t see a lot of activity in factories as orders decline. There will be less work and that will reflect itself in the stock market,  in particular the S&P (red chart).

The durable goods orders chart is the less volatile of the two and should be a good indicator for the S&P, which is more volatile.

In recent months we see the durable goods orders flatten out, which means the S&P will likely decline in the coming months.

Euro Strength Finally Manifested

I have been monitoring the euro versus U.S. bonds versus S&P.

U.S. bonds have been very volatile, one day they go up and the other day they go down. There is no consistency whatsoever in U.S. bonds (green triangles). The euro has been relatively flat against the U.S. dollar, but it posted the biggest increase since I started monitoring it the previous month (blue dots). I hope this will be the first sign of euro strength, which means commodities could start rising. The S&P started to go down lately, but today it was pretty bullish.
There is no decoupling yet: when the U.S. dollar goes down, stocks go up.

Chart 1: Monitoring of EUR/USD VS. 10 Yr US Bonds VS. S&P

Greece rating finally cut to junk

Today Moody’s finally cut Greece to the C rating. And C is the lowest rating there is.

This is their definition of ratings:

  • Aaa Obligations rated Aaa are judged to be of the highest quality, with minimal credit risk.
  • Aa Obligations rated Aa are judged to be of high quality and are subject to very low credit risk.
  • A Obligations rated A are considered upper-medium grade and are subject to low credit risk.
  • Baa Obligations rated Baa are subject to moderate credit risk. They are considered medium grade and as such may possess certain speculative characteristics.
  • Ba Obligations rated Ba are judged to have speculative elements and are subject to substantial credit risk.
  • B Obligations rated B are considered speculative and are subject to high credit risk.
  • Caa Obligations rated Caa are judged to be of poor standing and are subject to very high credit risk.
  • Ca Obligations rated Ca are highly speculative and are likely in, or very near, default, with some prospect of recovery of principal and interest.
  • C Obligations rated C are the lowest rated class and are typically in default, with little prospect for recovery of principal or interest.
So finally we are at the point that we are saved from all the BS from at least 1 rating agency Moody’s, as C is the lowest rating. We are all fed up with these meaningless rating cuts from these redundant rating firms. Greece is bankrupt, case closed…
We still have Fitch (credit rating C, still to be downgraded to D), Standard and Poor’s (sovereign rating: SD selective default, still to be downgraded to D (full default on due date)). If these two eventually downgrade Greece again, life will finally go on without this redundant, meaningless news.

Meanwhile, Greece’s 10 year government bond yields continue to move up. If we do know they are going to default at least by 90%. Then yields are still much too low at this stage.:

Greece 10 Yr Government Bond Yields (%)