Junk Bond Market Forecasts a Looming Stock Market Crash

There is a particular debt market that is very interesting to watch and that is the junk bond market. We call these bonds “junk bonds” because the debt is issued by corporations that do not have high credit ratings and they need to pay higher interest rates.

The reason why we need to monitor this market is the following. The high yield debt market is a leading indicator for the direction of the stock market. Whenever investors leave the junk bond market, yields will spike upwards and the price of these bonds will decline in value. This will lead to less borrowing and consequently lead to less spending. What we then see is a stock market crash with typically a delay of a few months (see chart below from FRED). You can clearly see that the stock market (red chart) is overdue for a correction as the high yield bond market (blue chart) is declining in value.

Read the full analysis here.

Greece Government Bond Yields Inverting

The inversion has begun again in Greece government bonds. Normally, higher maturity bonds have higher interest rates, because they are riskier to hold due to inflation. But sometimes the yield curve inverts (see chart below created by Correlation Economics).

As you know, 2012 was the year where Greece defaulted on debt as low maturity bonds crashed (yellow chart peaks out).

We might be seeing take two of that crash in 2015 as low maturity bonds are now re-inverting against high yield bonds. For more info, go here.

Has agriculture found a bottom?

The latest interview with Marc Faber (Barron’s) sparked an idea with me. In that interview he said that palm oil was going to do well. The palm oil price is very much correlated with the soybean price and we are seeing a rebound in soybeans at this moment, while palm oil hasn’t seen a rebound yet. As a Belgian, the best way for me to invest in this idea is to buy shares of Sipef (SIP). These profitable companies will pay dividends of 2%-4%, way higher than what you get in European bonds and cash.

http://video-api.wsj.com/api-video/player/iframe.html?guid=F2F49CAB-128C-427B-8E7B-A07B030D1405

Currently, the low crude oil price has dragged the palm oil business down with it. Why you say? It’s all because of the derivatives complex. But we are seeing price reversals in agriculture at this moment. For example, when we look at the overall agriculture commodity index RJA, it is showing a bottom.

Also, potash prices are finally on the rise. We have seen the first uptick move in over more than 3 years and potash companies have seen rebounds as well. So, plenty ideas for your next investment!

Which one will collapse: USD or U.S. bond yields?

An arbitrage opportunity has come up on the forex and bond market. The USD has strengthened so much that something has to give. Either the USD (red chart) will collapse or U.S. bond yields (blue chart) will collapse.

I have the feeling the U.S. bond yields will collapse. That also means stocks will collapse as people will sell stocks to get into bonds..

Dividend Yield Vs. Bond Yield

It pays off to compare the dividend yield and the bond yield in the U.S.

A very long time ago, before 1970, dividend yields on stocks were on average priced at 120% of the triple AAA bond yields. So if a bond gets you 10% return, the dividend yield would get you 12%. That’s because stocks can default and are riskier than bonds which are less likely to default.

But since 1970, this has changed.with the rise of mutual funds. The ratio of dividend yields versus bond yields dropped to around 20% (see chart below). Today we are at 100% so we are back in line with history (with stocks just a little bit overpriced). Just keep in mind that we have the 120% rule and try to follow this rule (to keep your sanity in these volatile markets).

U.S. bond yields can be found here:
//research.stlouisfed.org/fred2/graph/graph-landing.php?g=QA9 Dow Jones dividend yields can be found here:
http://www.investmenttools.com/equities/fundamentals/dow_jones_dividend_yield.htm

Fed Asset Purchases Vs. Bond Yields

How counter intuitive it may seem, when the Federal Reserve tapers (reduces asset purchases of bonds and mortgages), the bonds actually go up instead of down. This article explains it clearly. So you can predict what bond yields will do by listening to the asset purchase plans of the Federal Reserve. Then profit on it.

The obvious reason is that reduction of QE is good for the dollar (and good for bonds), while QE is bad for the dollar because it generates inflation concerns (hence bad for bonds).

So QE will send bond yields higher because of inflation concerns, while reducing QE will send bond yields lower.

The second reason is that all of the money printing goes into capital goods like stocks. When QE ends, stocks will drop and that money goes back into bonds.

Conclusion: Expanding Fed balance sheet sends bond yields higher and vice versa.

GDP Growth Rate Vs. 10 Year U.S. Treasury Bond Yield

The 10 year treasury bond yield can be viewed as the fixed-income market’s assessment of current nominal GDP growth on a year to year basis.

So from the chart below: GDP growth (red) should correlate to the 10 year U.S. bond yield (blue).

By monitoring the 10 year U.S. bond yield, you should have a good view on U.S. nominal GDP growth.

Federal Reserve: To Taper or not to Taper

There is all this talk about “tapering”. Will the Federal Reserve taper or not taper, that’s the question. To find the answer, we need to take a look at the U.S. national debt.
This is really a weird sight, do we really have an actual debt ceiling? Aren’t we going to raise the debt ceiling? U.S. public debt has been growing at almost $200 billion a month and has been staying flat just recently.
Chart 1: U.S. Public Debt

Since May 19, 2013, the debt ceiling has been stuck at $16.735 trillion and this ceiling has been in place for almost 2 months as chart 1 suggests. The treasury says that they would be able to pay all the bills until October by enacting extraordinary measures from May 20 till August 2.

In all, the Treasury has the following measures available to it:

  • Suspend the investments of the Thrift Savings Plan G Fund (otherwise rolled over or reinvested daily, such investments totaled $130 billion in Treasury securities as of May 31, 2013);
  • Suspend investments of the Exchange Stabilization Fund (otherwise rolled over daily, such investments totaled $23 billion as of May 31, 2013);
  • Suspend the issuance of new securities to the Civil Service Retirement and Disability Fund and Postal Service Retiree Health Benefits Fund (totaling an estimated $79 billion on June 30, 2013, and about $2 billion each subsequent month);
  • Redeem early securities held by the Civil Service Retirement and Disability Fund and the Postal Service Retiree Health Benefits Fund equal in value to expected benefit payments (valued at about $6 billion per month);
  • Suspend the issuance of new State and Local Government Series (SLGS) securities and savings bonds (between $4 billion and $17 billion in SLGS securities and less than $1 billion in savings bonds are issued each month); and
  • Replace Treasury securities subject to the debt limit with debt issued by the Federal Financing Bank, which is not subject to the limit (up to $8 billion).

And due to higher tax revenues at the start of 2013, we see that interest payments on government debt weren’t a problem. In fact, the interest payments as a percentage of tax revenue has been declining since 2013 (Chart 2).

Chart 2: Interest payments as a % of tax revenue

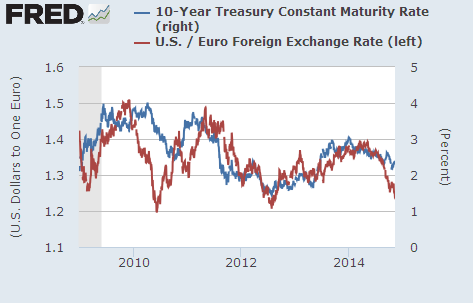
Though, there is one parameter that was not anticipated and that is the effect of higher interest rates and higher mortgage rates.

Read the analysis here.

30 Year Fixed Mortgage Rate Vs. 30 Year U.S. Treasury Yield

This page is created to monitor the 30 year Conventional Fixed Mortgage Rate Vs. 30 year U.S. Treasury Yield.
There is an obvious historical correlation here. The thing to watch here is that the mortgage rate (blue chart) should always be higher than the treasury yield (green chart).
When this is not the case, U.S. treasury yields should decline / mortgage yields should increase.