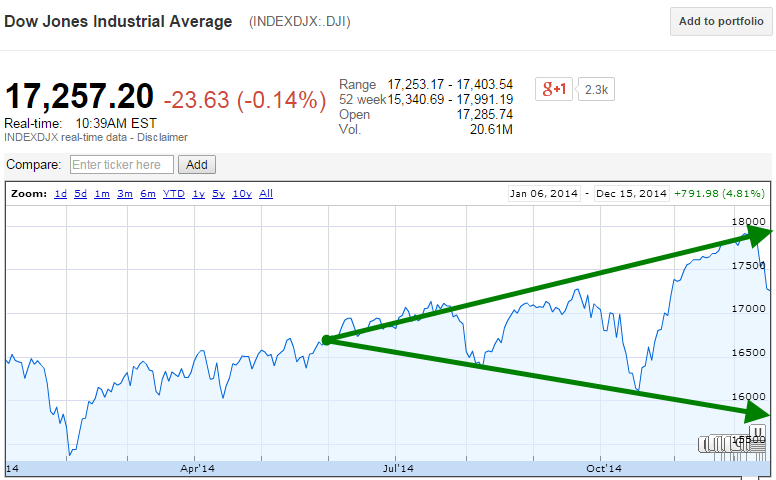
Smart Money Flow Index Vs. Dow Jones

A very helpful index to predict what the Dow Jones is going to do is the Smart Money Flow Index. Just follow the smart money and the Dow Jones will correct itself to the smart money index. The only problem I have is that this SMFI index is not free of charge…

Smart Money Flow Index
The Smart Money Flow Index (SMFI) has long been one of the best kept secrets of Wall Street. Everybody knows the importance of a closing price and other last hour indicators like the Closing Tick, which we publish daily on our portal.

The Smart Money Flow Index is therefore calculated according to a special formula by taking the action of the Dow in two time periods: the first 30 minutes and the last hour. The first 30 minutes represent emotional buying, driven by greed and fear of the crowd based on good and bad news. There is also a lot of buying on market orders and short covering at the opening. Smart money waits until the end and they very often test the market before by shorting heavily just to see how the market reacts. Then they move in the big way.

These heavy hitters also have the best possible information available to them and they do have the edge on all the other market participants. It is a clear buy signal if the Dow falls to a new low which is not confirmed by the SMFI. But whenever the Dow makes a high which is not confirmed by the SMFI there is trouble ahead (Chart below). Watching this indicator is like being on a plane and see the pilots jumping off with parachutes. This magnificent indicator has called every major top and bottom.

Another index is the SMI index. The basic formula for SMI is:

Today’s SMI reading = yesterday’s SMI – opening gain or loss + last hour change

For example, the SMI closed yesterday at 10000. During the first 30 minutes of today’s trading, the DJIA has gained a total of 100 points. During the final hour, the DJIA has lost 80 points. So, today’s SMI is 10000 – 100 + -80 = 9820.

So basically, when you see people buy at the opening and sell into the close, you should become bearish.

Total credit market debt Vs. Dow Jones

Total credit market debt growth is correlated with the Dow Jones. As everything in the economy requires loans, credit expansion drives the economy today.
Whenever this credit growth stops (blue line drops), the Dow Jones (red line) will go down with it. We have seen this in the 1987, 2000, 2008 crashes.
Monitor the blue line as it may be an important indicator.

The U.S. Government Has Invented a New Way of Calculating GDP

In March 2013, the U.S. government invented a new way of calculating GDP. The Financial Times reported that from July 2013 onwards, the U.S. GDP would become 3% bigger due to a change in statistics.  As this adjustment in GDP calculation is pretty significant, I will try to make an observation on which changes on the U.S. GDP will take effect, what the consequences are and how investors should act on this revision in statistics.

Read more here.

U.S. Federal Reserve Balance Sheet Vs. Dow Jones

This page is created to monitor the U.S. Federal Reserve Balance Sheet’s assets Vs. Dow Jones.
Whenever the Federal Reserve expands its balance sheet (blue chart), the Dow Jones will rise with it (red chart). 
Conversely, when the Federal Reserve Balance sheet stays flat, the Dow Jones is likely to drop.