I wish you all a Happy New Year for a successful 2012 blogging year.
See you in 2013 and here is me playing a medley from Final Fantasy XIII-2 I just arranged for this occasion from my favorite composer Masashi Hamauzu.
It’s official, registered gold and silver is being dumped. That means that open interest is declining in the COMEX. Why this is you can find out here: http://katchum.blogspot.be/2012/12/comex-gold-stock-keeps-declining.html
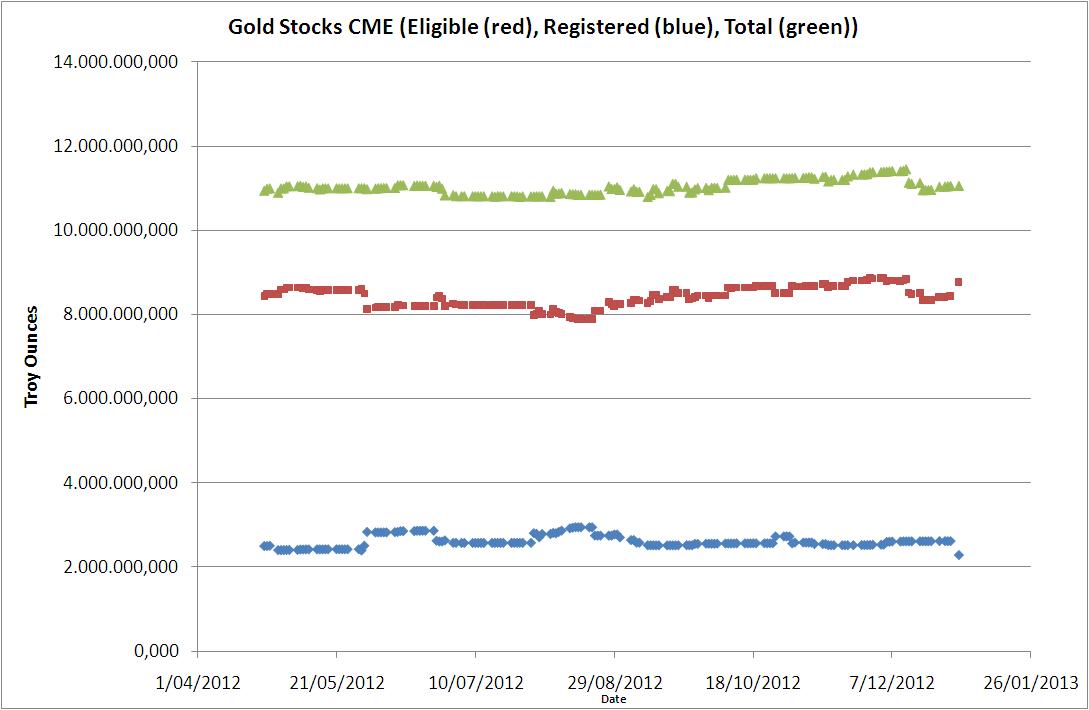 |
| Chart 1: COMEX Gold |
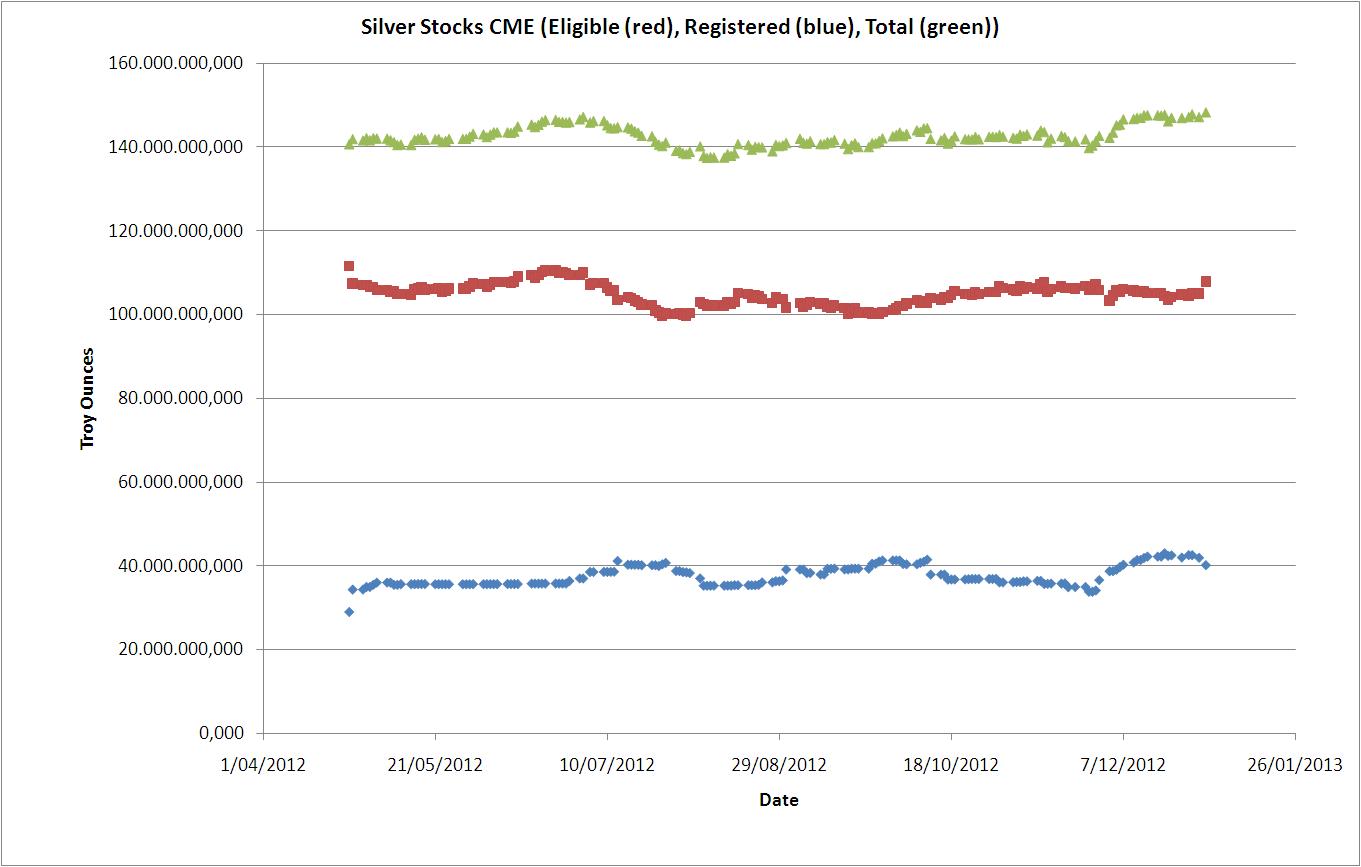 |
| Chart 2: COMEX Silver |
The total foreign exchange holdings have grown 2% quarter over quarter to 10.8 trillion. Annualized it amounts to 8% per year (which matches the MZM increase of money supply as pointed out by Michael Pento). That also means that gold should go up 8% per year at least to match foreign exchange holdings.
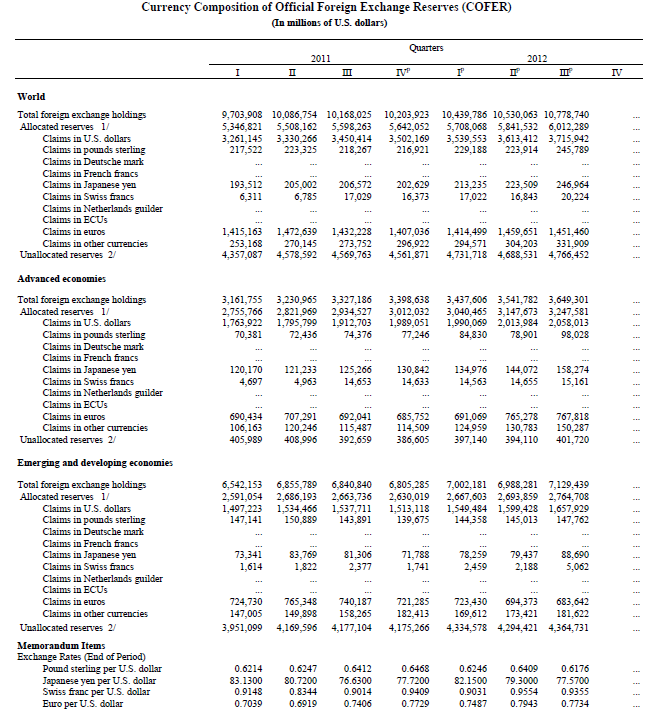 |
| Table 1: COFER Q3 2012 |
What’s interesting to note is that people have dumped the euro ($1459 billion to $1451 billion) and bought the USD ($3613 billion to $3716 billion). The USD is still managing to preserve its reserve currency status after all. The euro did show a lot of weakness in Q3 of 2012.
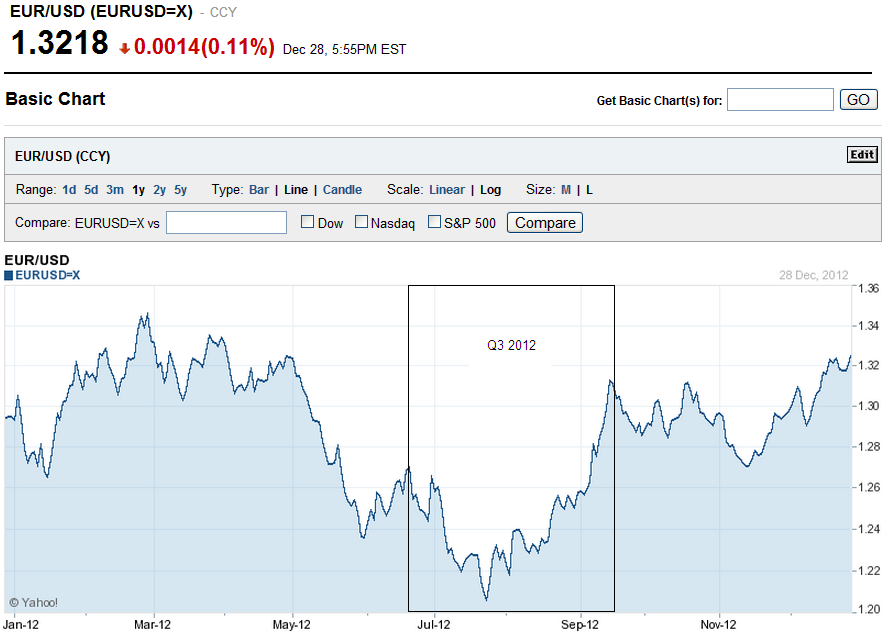 |
| Chart 1: EUR/USD |
I wonder what Q4 will bring as the euro went up in terms of gold while eurobonds were increasing in value against US bonds. I also wonder what will happen next year when QE3 is going to be implemented. Will they flee the USD and the Japanese yen?
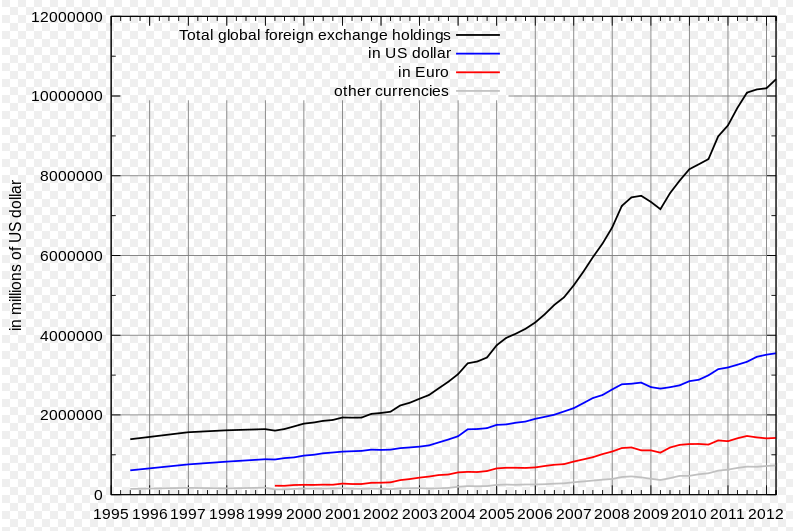 |
| Chart 2: Foreign Exchange Reserves |
It’s safe to say that the worst is over in the gold market as lease rates have just made a new high since the dip in the beginning of December. The COT reports also show that the large commercial silver shorts have now been covered for a small part to the extent of the number reported on November 2012. Open interest declined with it.
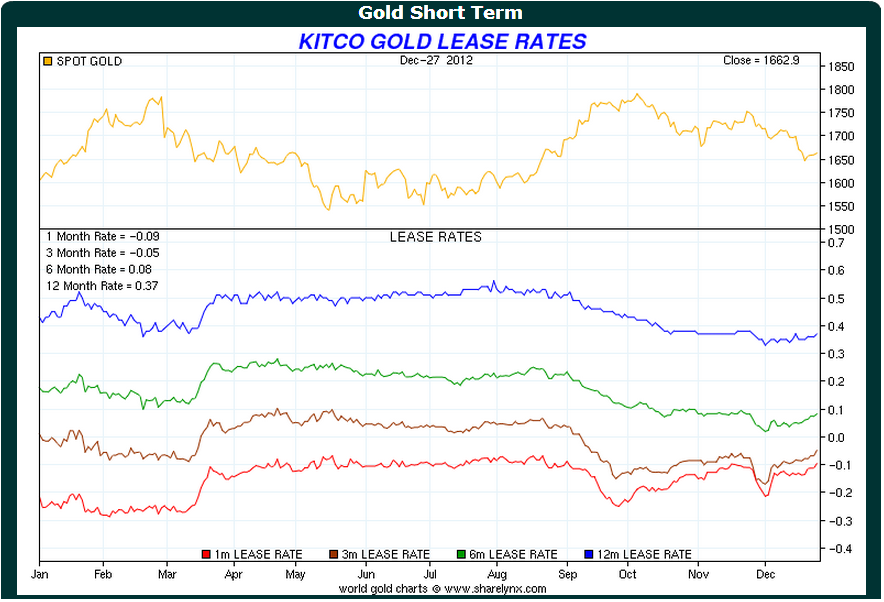 |
| Chart 1: Gold Lease Rates |
I’m not sure what the status is on the silver lease rates, but that trend line should follow the gold market soon.
I came across an interesting chart on King World News and want to store it on this blog. It can come in handy later on.
 |
| Chart 1: West/East Gold Reserves |
But as you can see, even the Western banks are now buyers of gold since the eruption of the 2008 crisis.
The top in March 3, 1965 is a very peculiar year. That year, president Johnson approved the Gold reserve law, repealing the backing of Federal Reserve deposits with gold. This law marks the trend to remove gold from the monetary system. In 1967, only 3 nations backed their monetary systems with real gold, now nobody does. The law was a means to expand the monetary system as gold would become less important concerning reserve requirements. And then in 1968, gold backing of Federal Reserve notes was repealed too. So nobody was interested to hold gold in their central bank.
But today, with the expansion of all this paper money and bonds, the gold standard should be reimposed and central banks know this, even Western central banks are now again buying gold as you can see on the blue trend on chart 1.
Capstone Mining (CSFFF.PK) just announced a share buyback, let’s take a quick look at the numbers.
Capstone mining had 382 million shares outstanding on September 30. Cash was at $510 million, assets were at $1.5 billion and equity was at $1.4 billion.
Market capitalization was considerably lower than equity: $874 million. So it is a very good idea of management to announce a share buyback on 27 December 2012.
In this share buyback program, Capstone Mining can buy approximately 10% of all outstanding shares or 34,014,871 shares ($80 million over a time period of 1 year). Capstone Mining has a lot of cash as compared to its equity. So I believe the company will buy back shares with its cash position. After the buyback, this will leave the cash position of the company at approximately $500 million considering its net earnings are at $15 million per quarter.
So basically nothing significant will happen to the cash position over the next year. The buyback will reduce the amount of shares by as much as 34 million shares. The earnings per share will increase 10% as a result of the buyback and that means that the P/E ratio will drop 10%, making the valuations more interesting for investors to accumulate Capstone Mining’s shares.
To read on, go here.
This week, the copper contango remained high, but the copper price fell. So I still expect the copper price to go higher as we move to backwardation. The copper contango theory will not be wrong.
The next step to extend this copper contango theory is to identify the tops and the bottoms of the contango. What are the upper limits of contango and lower limits of the backwardation?
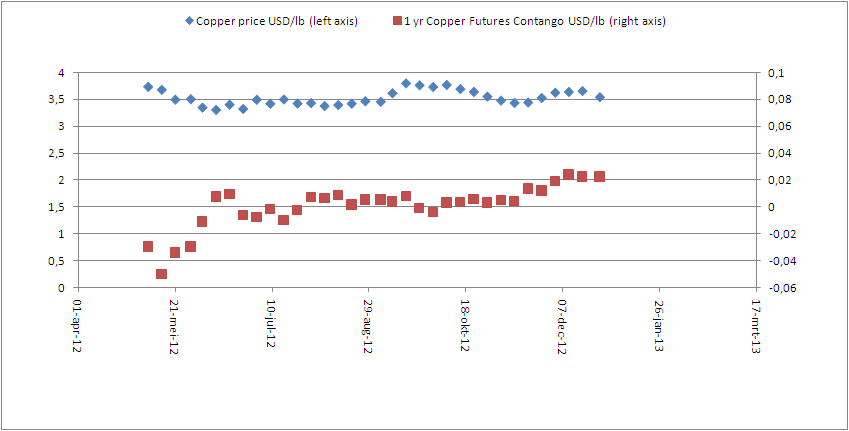 |
| Chart 1a: Copper Contango Vs. Copper Price |
If we quickly look at history, we can see that in 1988, we got a price of $1/lb copper and a backwardation of around $0.2/lb. That’s 20%. If we then look at another data point in 1996, we got a price of $1.25/lb and a backwardation of around $0.1/lb. That’s 8%. Similarly, in 2006 we got 7%. For contango we have 13% in 1982, 7% in 1993, 2% in 2008.
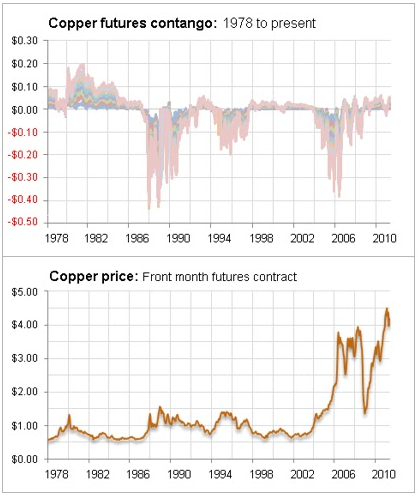 |
| Chart 1b: Historical Copper contango |
There is one caution however, the LME copper stock levels are surging in exchange warehouses, which will put a cap on the rise in copper price and may even bring the copper price down.
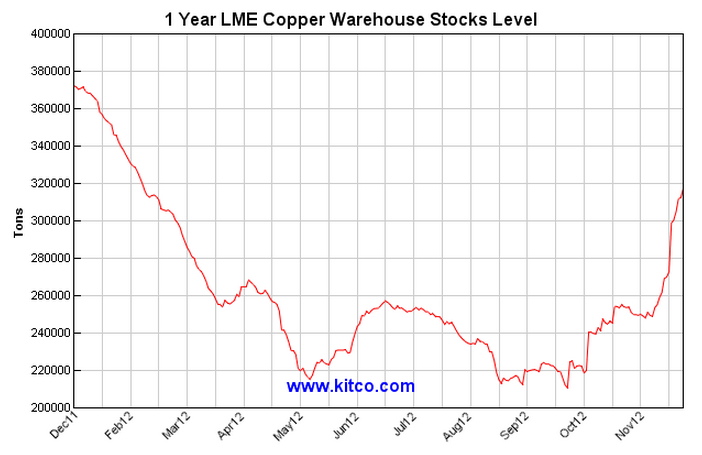 |
| Chart 2: LME Copper Stock |
I decided to add Kyle Bass to the list of gurus on this blog.
He seems like a smart guy, knowing a lot about debt. And he is pro-gold.
Most important is that he says Japan is going to have a bond bubble crisis as early as next year (2013). I talked about this here and it shows that revenue of Japan is quickly going down, while interest expense is just being kept low by printing yen to buy government bonds. But, the interest payments as a percentage of tax revenues is rising, even when rates are being kept low. I said there is a point where it doesn’t work anymore.
That point has arrived: The problem is, if the current account goes negative, which is already happening now, the fiscal deficit can’t be maintained any longer (previously, the current account surplus was higher than the fiscal deficit. Not anymore now). Meaning, the tax revenues will eventually all go to the payment of interest on debt.
Result: implosion of Japanese bond market and nominal rise of Japanese equities. Japanese pension funds will buy huge amounts of gold. (BTW, Nomura has already surged a lot, maybe it’s time to cash in the profits)
Watch his 2012 seminar here:
http://www.youtube.com/watch?v=JUc8-GUC1hY


