Let’s compare the two charts. The first one is the
amount of gold deliveries to Shanghai gold exchange, or equal to the amount of gold withdrawn from the Shanghai Gold Exchange Vaults, which can be accessed
here. The SGE withdrawal numbers in chart 1 is equal to Chinese imports and Chinese mine supply and is equal to Chinese demand for gold because all the gold is sold through the SGE. Note that January and December are the best months, because the Chinese have New Year in February.
The second chart are the China gold imports.
 |
| Chart 2: China Net Imports from Hong Kong |
Now let’s put them together. What do you see?
 |
| Chart 3: Chart 1 + Chart 2 |
First of all, the amount of gold withdrawn from the SGE is always higher than the net imports from Hong Kong to China. Chart 1 x 4 > Chart 2. That’s because SGE covers imports and Chinese mine supply.
Second, both charts go up in time, which means Chinese increasing demand is real. You can even predict what the Chinese gold imports from Hong Kong will be, just by looking at the weekly numbers from SGE.
Third, the SGE numbers are approaching world mine supply (yellow blocks), which means the Chinese are buying up all the gold that is produced in the world at this moment. The only way the Chinese can get a hold of this gold is by buying it from someone who is selling (aka The West).
Fourth, if you look at the imports as a ratio of SGE deliveries, the Chinese are importing more and more gold instead of producing it. A few years ago they only imported 10 tonnes a month on a SGE delivery of 60 tonnes a month. Now they are importing 100 tonnes a month on a SGE delivery of 160 tonnes a month. That’s an increase from 15% to 60%.
Fifth, now we come to the real interesting part. If we shift the two charts 4 months from each other. Then we see a perfect correlation. It means that when the SGE deliveries go up (Chinese demand goes up), then China needs to import more gold a few months later (imports from Hong Kong go up). The lag is about 4 months. This means we have a leading indicator for China gold imports from Hong Kong. I’m not sure about this correlation yet, we’ll see when we get more data in the following year. But it looks promising. That also means you should follow the SGE gold deliveries rather than following the China gold imports from Hong Kong. (Edit: correlation confirmed by Koos Jansen)
 |
| Chart 4: Chart 1 + Chart 2 Shifted 4 Months |
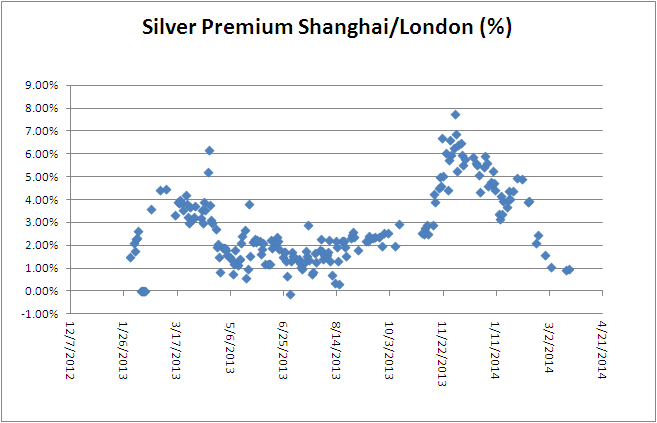
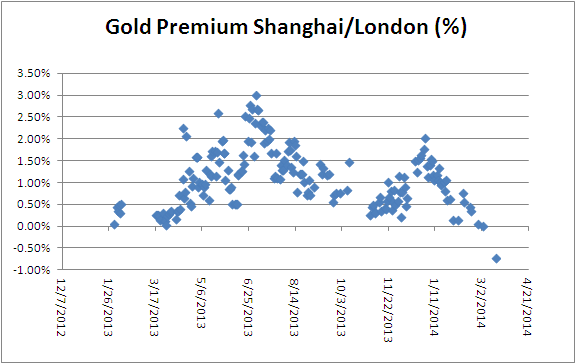
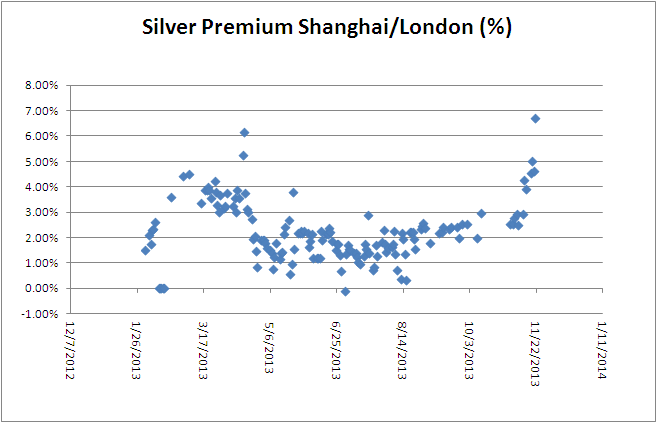
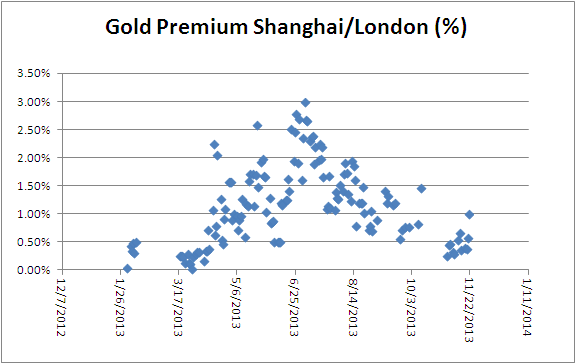
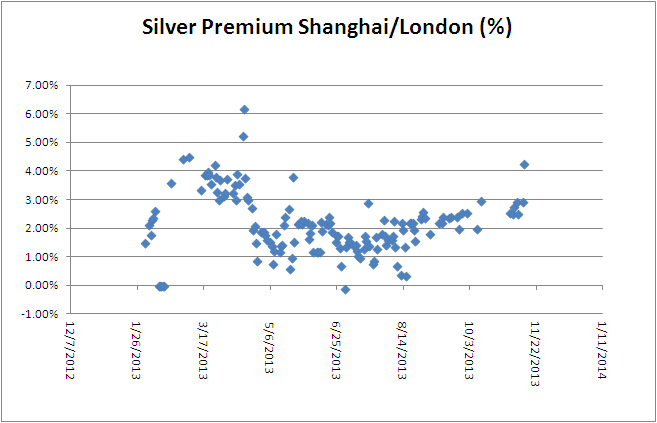
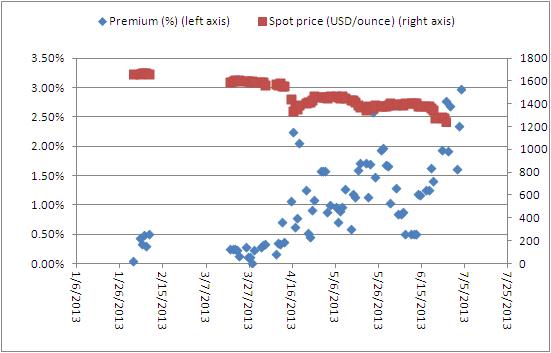
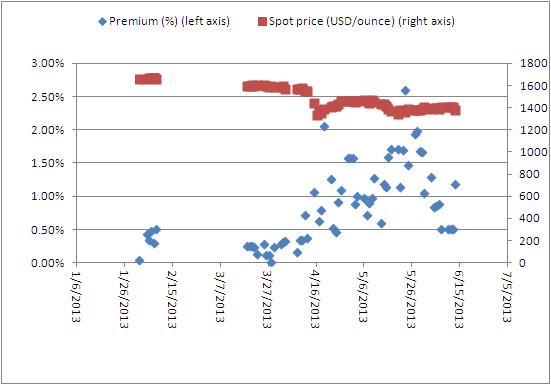
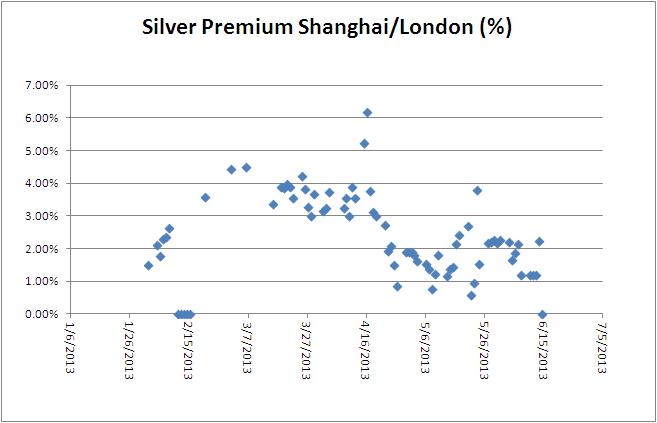
Sixth, now it becomes even more interesting. Whenever the volume of delivered gold at the SGE goes up, the premium between Shanghai and London goes up. See Chart 5 peaks in June and December which coincide with the peaks from Chart 1. This also means that you can monitor daily the premiums on Shanghai and then predict the weekly delivered gold at the SGE.
 |
| Chart 5: Gold Premium Shanghai/London |
Let’s recapitulate: In December, we see the gold premiums spike to 1.5%, which means there is a lot of delivery at the SGE (flowing out of GLD), which means Chinese gold demand is going up and that means that 4 months later we will see higher gold imports from Hong Kong.