With the recent surge in the mortgage yields, let’s see how the housing market is doing. The two key metrics to look at are mortgage rates and household income. Let’s analyze the mortgage rates first.
Historically, there is a high correlation between 30 year U.S. treasuries and 30 year mortgage rates (Chart 1). The chart shows that the 30 year treasury yield has spiked upwards starting in 2013, so I expect that the 30 year mortgage rates will spike upwards too. 30 year mortgage rates have already gone up from 3% to 4.9%, which had negative consequences for the real estate market, which is not priced in yet in the housing index.
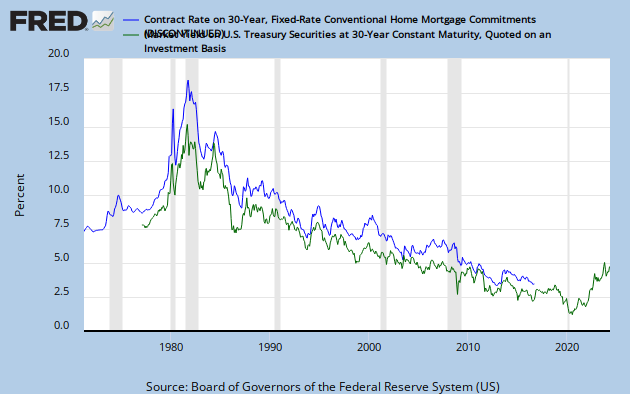 |
| Chart 1: Correlation between 30 year treasury yield and 30 year mortgage yield |
As Zero Hedge reports, the affordability of housing is declining rapidly with rising mortgage yields. Every percentage increase in yields on 30 year mortgages will result in a 10% decline in affordability as the chart shows. If yields continue to go up to 6%, affordability would have declined about 40% since 2013.
 |
| Chart 2: House Purchasing Power |
The question is, will mortgage rates go up further? And what about the savings rate of the average citizen?
The answer is that real estate should be sold out of. Kyle Bass for example sold out of three of his real estate holdings: Newcastle Investment Corp (NCT), Hyatt Hotels Corporation (H) and Realogy Holdings Corp. (RLG ) – Real Estate Services.

