What nobody reports on is that capacity utilization, for the first time in many years, has gone above 80% in November 2014. History shows that once the 80% level is broken, inflation will most certainly follow.


Remember, when the CPI goes up and bond yields drop, gold goes higher. And that’s exactly what is happening now. Bond yields are lower and CPI is higher.
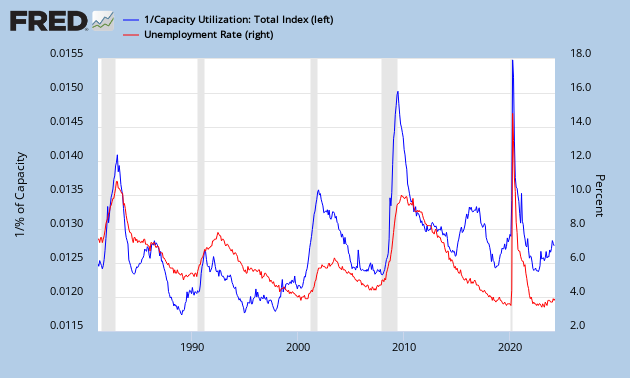
The chart below points to a year over year CPI rate of 5% in the coming future. And we’re already half to that number as the latest consumer prices pointed to a 0.2% increase in prices in the month of March, or a 2.4% inflation rate per annum.
You can be sure that inflation is coming and you should prepare for that accordingly.

Previously, I noticed that capacity utilization for mining in the U.S. was improving in November 2012, with the rate growing to 91.1%. Though, the problem is that the U.S. isn’t that important anymore when talking about commodities. For example, in 2012 the emerging markets account for 75% of global iron ore consumption (Chart 1), while Asia, South America and Oceania account for more than 70% of global iron ore production (Chart 2). The same trend can be found in gold and silver production/consumption.
 |
| Chart 1: Iron Ore Consumption by Continent |
 |
| Chart 2: Iron Ore Production by Continent |
To read the analysis, go here.
We have good news, capacity utilization for the total industry improved in November 2012, from 77.7% the previous month to 78.4% this month.
What’s even better news is that capacity utilization for the mining industry went up to 91.1%, the highest for several years and above the historic average.
Utilities and manufacturing capacity utilization rates both went up significantly.
This information can be very important as it points to inflation.
For more information you can read my previous article on capacity utilization.
In Canada the capacity utilization rate has climbed from 80.5% the previous quarter to 81%. As Canada is a resource based economy, this could be an indication that the commodities market will improve in the next quarters. Capacity utilization rates above 80% are inflationary.
U.S. capacity utilization took a dive in August 2012 to 78.2%, much less than the forecast. This is the lowest since October 2011 and a huge break of the trendline. We can’t make too much conclusions on this number because QE3 has just been announced and will have an effect on the future.
Good news for inflationists!
Capacity utilization for July 2012 came in at 79.3 (up from 78.9 a month ago), which is the highest number since April 2008. That also means we are nearing the danger zone of 80. Once we get above 80, you can bet that we will get high inflation after a few months from now.
All different industries were higher in capacity utilization with the mining industry posting an astounding 90.4 capacity utilization rate in July 2012, up from 89.5 a month ago.
There is absolutely no indication that precious metals won’t go higher in the future.
 |
| Chart 1: Capacity Utilization |
Good news! The capacity utilization rate for the total industry in June 2012 came in at 78.9%, up from 78.7% a month ago (Chart 1).
 |
| Chart 1: Capacity Utilization Rate |
