Gold Has Now Hit Marginal Cost of Production

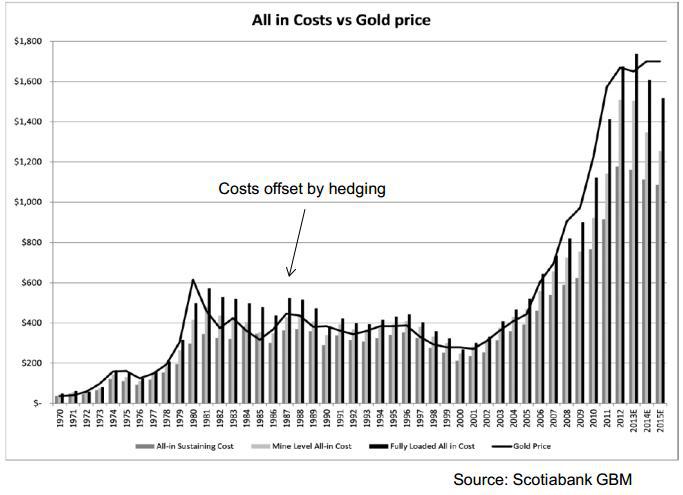
In this post I will try to explain how important it is to watch the total marginal cash cost of gold mining to predict where the gold price (GLD) will be headed to. This marginal cost can be divided in two parts: cash cost of production and other costs (exploration, construction, maintenance, etc…) and stands at around $1300/ounce. With the recent decline in the price of gold, I believe we have finally hit the bottom.

The gold price has always followed the marginal cost of suppliers throughout history (Figure 1). The correlation between gold prices and gold mining cash costs between 1980 and 2010 stood at 0.85, which is pretty highly correlated (Source: CPM Gold Yearbook 2011).

With the price of gold at $1400/ounce today I’m pretty sure we can’t go much lower if this correlation proves to be correct.

The following chart is the most important chart every gold investor needs to be aware of. As I mentioned before, there is a high correlation between the all in cash costs of gold mining and the gold price (Chart 4). So investors need to monitor the total cash cost of gold mining in order to predict the trend in the gold price itself.

(click to enlarge)

Continue reading here.

Bank Deposits Update: Spain is in trouble

Time for another bank deposit update for the month of April 2013.

Cyprus continued to have a bank run in deposits, but the most interesting event is that Spain’s deposits are starting to deteriorate too.
Guess where the deposits are going to? Yes, Germany, France, Italy and even Belgium.
That means that money is flowing from the periphery into the center of Europe. I wonder how long this imbalance can continue.

Shanghai Gold Premium Skyrockets to New Highs

One of the most important features of this blog is that you get real time alerts on important data.
One of those data is the premium I see on the Shanghai precious metals market. And today we see a huge increase in premium in gold (Chart 2). Gold premiums to London bullion price have reached 2.6%, the highest since I monitored it. Silver premiums also shot up to 3.8% (Chart 1).
That’s a bullish sign.
James Turk talked about these huge premiums in Asia:

The huge premiums over spot in Asia and the long delivery times in London clearly show that this takedown in gold over the past few weeks was all about what was taking place in the paper market.

Chart 1: Silver Premium Shanghai to London

Chart 2: Gold Premium Shanghai to London

Correlation: Gold/Silver Ratio Vs. S&P

Zero Hedge thaught us another correlation. The Gold/Silver Ratio actually has a meaning.

When the ratio goes up, gold goes up more than silver, which means fear is growing. In that environment, the stock market declines. Conversely, when the gold/silver ratio declines, silver is stronger than gold, which means fear is going away and the risk-on trade is prevalent.

Another way to look at it is: when stock markets plunge, silver won\’t do well.

Chart 1: Gold/Silver Ratio Vs. S&P

So we have yet another tool to predict the stock markets. Just keep it in mind.

You can monitor the Gold/Silver ratio here:
http://stockcharts.com/freecharts/gallery.html?s=%24GOLD%3A%24SILVER

Correlation: Gold/Silver Ratio Vs. S&P

Zero Hedge thaught us another correlation. The Gold/Silver Ratio actually has a meaning.

When the ratio goes up, gold goes up more than silver, which means fear is growing. In that environment, the stock market declines. Conversely, when the gold/silver ratio declines, silver is stronger than gold, which means fear is going away and the risk-on trade is prevalent.

Another way to look at it is: when stock markets plunge, silver won’t do well.

Chart 1: Gold/Silver Ratio Vs. S&P

So we have yet another tool to predict the stock markets. Just keep it in mind.

You can monitor the Gold/Silver ratio here:
http://stockcharts.com/freecharts/gallery.html?s=%24GOLD%3A%24SILVER

Disconnect between selling price of physical silver and paper silver

As the paper silver keeps falling (blue chart), some miners aren’t willing to reduce their selling price (red chart) on their silver bullion.

This lead to a huge disconnect between paper and physical silver of $5.5/ounce, or a 25% premium!

Chart 1: Disconnect between Physical Silver and Paper Silver at First Majestic Silver Corp

Correlation: Monitoring the GLD Trust ETF to Predict Gold Prices Based on Demand

As demand is now being dictated for a part by the ETF’s, we need to pay attention to what is happening in the trusts. Are they unloading their gold? Because if they keep unloading their gold, the demand from ETF’s is going to decline, which has a negative impact on the gold price. This is the theory of supply and demand.

You can monitor this chart daily at the SPDR gold trust site:
http://www.spdrgoldshares.com/usa/historical-data/

Chart 1: GLD Trust: Units in the trust (tonnes)

As I indicated here, ETF’s were the largest sellers in gold, resulting in a 13% decline in the demand for gold. I cannot stress how important it is that ETF’s keep buying gold. If they don’t buy, like what happened starting in 2013, then the price of gold will decline. The great difference between 2013 and 2008 is that in 2008, ETF’s were massive buyers of gold, while today they are massive sellers. Keep watching this trend. If it reverses, you can confidently start buying precious metals

The Great Disconnect in the Paper and Physical Precious Metals Market

Over the last few months, precious metals investors have seen their net worth decline due to declining precious metals prices (GLD), (SLV). A lot of this decline in precious metals prices was due to a decrease in demand, which was the result of selling by hedge funds as the World Gold Council reported here.

First quarter gold demand of 963 tonnes was down 13% compared with Q1 2012 due to an outflow in the total gold ETF holdings of 177 tonnes. 2013 marks the first year in a decade where ETF’s are actually selling gold. While ETF holdings were reduced, this selling has been countered by an increase in physical demand for gold by China and India. Total demand in China rose 20% to 294 tonnes in Q1 2013 as compared to Q1 2012 (50 tonnes increase).

This huge increase in demand for physical gold can be witnessed on Chart 1, which gives the net imports of gold from Hong Kong to China.

While Chinese demand for gold was strong, Indian demand increased at an even higher pace. The Indian demand for gold increased 27% on the same quarter last year to 257 tonnes.

On the supply side we see a total increase of 1% in the first quarter of 2013 as compared to Q1 2012. Mine production increased 4% while recycling of gold decreased 4%.

(click to enlarge)

So, the reason for the decline in precious metals prices is evident from an increase in supply (mine production increased) and a decrease in demand for gold (ETF outflows) (Chart 2). But there is an important point I need to make here. While the supply side is pretty constant at 1% increase, the demand side is the critical indicator we need to look at with its 13% decline. The decline was a result of hedge funds converting their gold holdings into equities. The Dow Jones (DIA) hit an all time high last week, fueled by a bullish prospect in the equity market of Japan, which on itself was a result of the massive Japanese monetary stimulus announced in April 2013. Although investors are cheering the bull market in equities, the macroeconomic conditions keep worsening. A few examples were a deterioration in PMI, capacity utilization, ISM manufacturing, vehicle sales, ADP employment, initial claims, PPI, mortgage applications, wages.

To see what this means for gold, read on here.

Gold Lease Rate

This page is created to monitor the “Gold Lease Rate”.

The gold interest rate earned on fiat gold is commonly referred as the gold “lease” rate.

It is calculated as:

Gold Lease Rate = Libor Rate – Gold Forward Rate.
The LBMA presents the data every day at this link.
Whenever the gold lease rate tops out (spikes upwards), the gold price will hit a bottom as central banks demand the gold back from the bullion banks at higher gold lease rates. So it is a bullish sign to have high gold lease rates. It means that the GOFO rate is very low, which indicates backwardation in gold.