An interesting video about the German gold that isn’t there.
An interesting video about the German gold that isn’t there.
A year ago, 4 Swiss parliament members launched the “Swiss Gold Initiative” to repatriate their gold to Switzerland. Today, almost one year later we have 90000 supporters for this initiative. Once the 100000 supporters is reached, we are certain that the Swiss National Bank will repatriate their gold holdings. I’m sure those 10000 votes will be reached by March 2013.
So not only the Germans want their 3400 tonnes of gold back, now the Swiss want their gold back.
As of September 2012, the SNB had 55591 million CHF gold (Table 1). That’s 59139 million USD gold or 33.4 million ounces of gold or 1040 tonnes of gold. That’s one third of Germany’s gold and is pretty significant.
The SNB hasn’t said where its gold is and also hasn’t said if it will repatriate their gold all at once, but if they were to repatriate it all at once, it would be almost double the amount that Germany is now repatriating over 7 years: namely 674 tonnes of gold.
 |
| Table 1: Swiss National Bank Balance Sheet |
Other countries who want their gold back are: Ecuador (26 tonnes), The Netherlands (613 tonnes)
We have been seeing negative bond yields in Switzerland and Germany. Which is very odd if you ask me. The question begs to be asked: “How low can negative yields go?”.
To give an answer to this you need to have an understanding of the price-yield curve of bonds. You can gain money if yields go lower (bond price rises), but you will lose money because you need to pay interest on the negative yield. So there should be an equilibrium point and as a scientist I very much want to find that equilibrium point.
There is a very nice online tool for the price-yield curve on this site: Wolfram: Price-Yield Bond Curve.
Inputs for this tool are:
1) Years to maturity (if you buy a new 2 year bond it has 2 years to maturity)
2) Annual Coupon payment (the amount of cash you get per annum)
3) Yield (the annual percentage cash you get on the principal)
I will analyze the 2 year Swiss government bonds in this article.
 |
| Chart 1: Swiss 2 year Government Bonds |
Spain’s government bonds shot up today to 6.1%. At this rate we’re rapidly approaching the “danger zone” of 7% and above, often mentioned by James Turk. You can easily see LTRO I and LTRO II in this chart 1. Maybe Spain will need LTRO III to make the yields drop again…
 |
| Chart 1: Spanish Bond Yields (10 YR) |
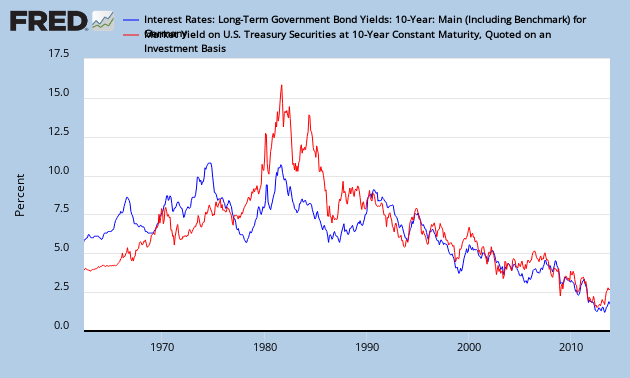
Meanwhile, people keep fleeing into German bonds, which dropped to 1.5%.
 |
| Chart 2: German Bond Yields (10 YR) |
