If you recall this correlation, I would run for the hills if you are invested in the S&P.
It will surely come down with the 7% plunge in durable goods orders.

Following the news on July 30, 2013, that Russia’s OAO Uralkali was abandoning Belarusian Potash Co., a joint venture with rival Belaruskali of Belarus, the whole potash industry’s stock market fell around 20%. Two cartels, Canpotex (PotashCorp, Mosaic and Intrepid) and BPC (Uralkali and Belaruskali), which control 40% and 30% of the potash market, would split up into three cartels: Canpotex, Uralkali and Belaruskali.
 |
| Chart 1: Potash Delivery Vs. Population Growth |
 |
| Chart 3: Potash Price (KCL) |
The World Gold Council sent out another report for Q2 2013 here.
As expected, we saw large ETF outflows both from GLD and other ETF’s, which led to a decrease in investment demand (Chart 9). But the decrease in investment demand was countered by an increase in jewelry demand, especially from India and China. We now see that the ETF’s have finally stopped selling their gold into the market, so I expect that Q3 2013 will be more positive on the demand side.


So the overall picture is that the gold price is especially dependent on the demand side, as the supply side is pretty flat. Watch out for the ETF’s and the physical demand for bars and coins. Once the ETF’s are done selling, we will see higher gold prices.
Looks like the media is telling us that the GLD trust physical gold holdings are rising and giving a boost to the precious metals prices.
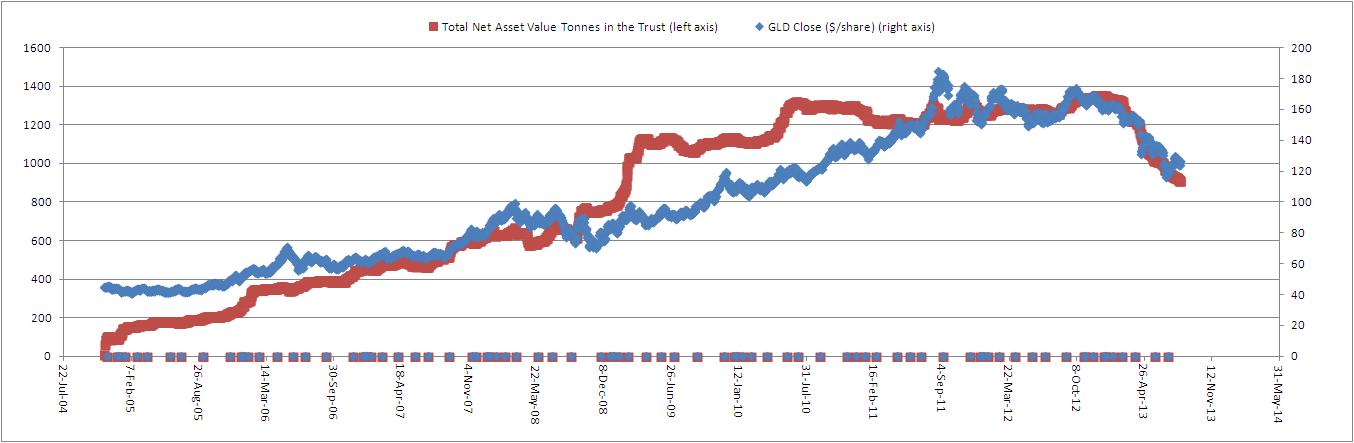 |
| Chart 1: GLD Trust |
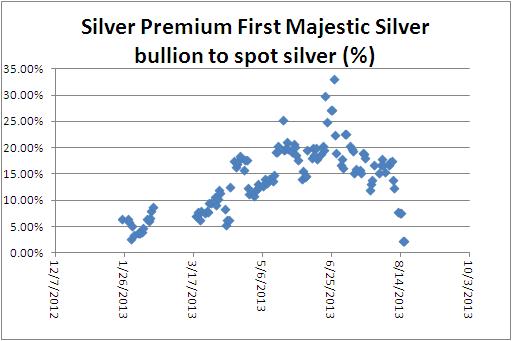
As for silver, we really start to see an uptrend here:
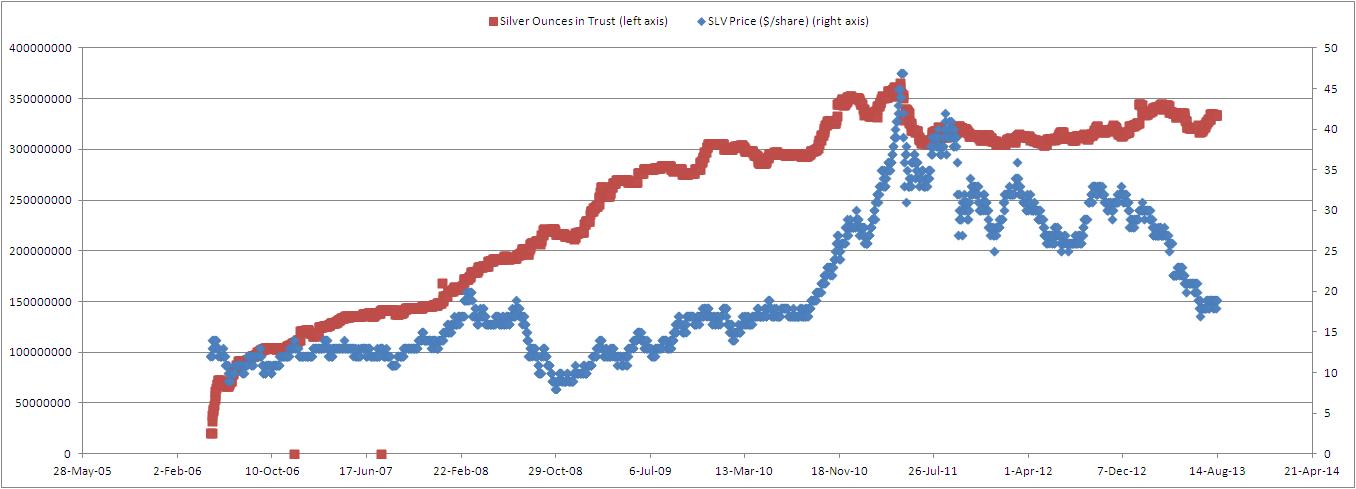 |
| Chart 2: SLV Trust |
Conclusion:
Silver is the most undervalued of the two precious metals.
Just another update.
Gold Lease Rates are at an all time high again:
| Chart 1: Gold Lease Rate |
COMEX registered gold has once declined to even lower levels. J.P. Morgan unloaded its registered gold. Total registered gold at COMEX now stands at: 875713 troy ounces. We are nearing the bottom.
 |
| Chart 2: COMEX gold |
As you can see on Chart 1, the decrease in deficit was due to an increase in exports (red chart) and a decrease in imports (blue chart). This looks very promising, but I want to show that not all is well if you look into the details.
 |
| Chart 1: Import Vs. Export |
Let’s look deeper into these import and export numbers. Chart 2 gives the breakdown of the export numbers. The largest segments are “machinery and transport equipment”, “chemicals and related products” “mineral fuels and lubricants” and “re-exports”.
 |
| Chart 2: Exports January 2013 |
Chart 3 gives the breakdown of the import numbers. The largest segments are ‘machinery and transport equipment”, “mineral fuels and lubricants”, “miscellaneous manufactured articles”.
 |
| Chart 3: Imports January 2013 |
From these numbers we can deduct that the oil industry is indeed a very important segment that will influence the import and export numbers.
If we then further look at how these numbers evolve in time from January 2013 till June 2013 we have charts 4 and 5.
 |
| Chart 4: Exports (billion USD) |
 |
| Chart 5: Imports (billion USD) |
When analyzing the trends on charts 4 and 5, there is one segment that is worth noting. We see that exports of petroleum products (which are incorporated in the segment “mineral fuels and lubricants”) have been going up, while imports of the same have been going down. The reason for this can be found in the divergence of West Texas Intermediate (WTI) crude oil and Brent crude oil.
To continue reading this analysis: go here.
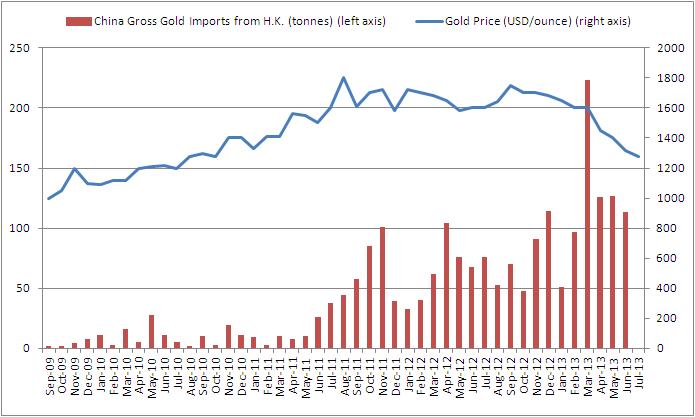
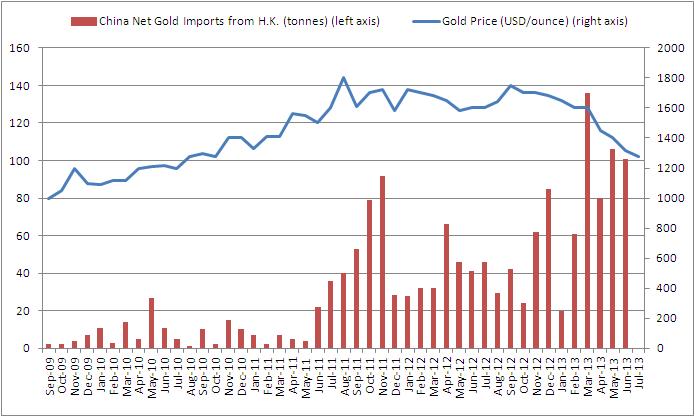
In June 2013, the gold imports from Hong Kong to China were essentially flat.
The summer isn’t a good period for gold either, so this is pretty normal. But anyway, gross and net imports are still at an all time high, compared to history (see chart 2).
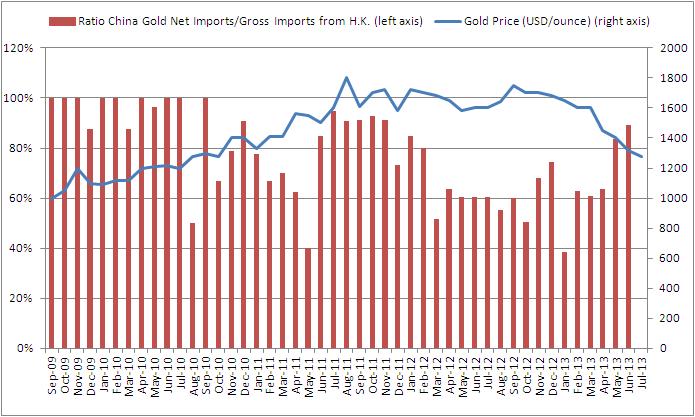
And what’s also interesting is that the ratio between net imports and gross imports are at an all time high too: 89%. China wants to keep all its gold.

To read more about this correlation go to this article.

