AISC Silver Miners

Gold has been on a tear since the start of 2016, while silver (SLV) has been underperforming. When we look at the gold/silver ratio, we see that we are at historic highs. The best time to buy silver could be approaching and there is no better way to leverage this move via silver miners.

In the chart below, I have summarized the cost cutting measures of several silver miners, based on their latest earnings release. These numbers represent the outlook for the given year.


To read the analysis, go here.

Update on AISC of Gold Miners

As a follow up of my previous post on the AISC of several prominent gold miners in 2014, here is an update for 2015.

As many precious metals investors know, the price of gold (NYSEARCA:GLD) was smashed to 5 year lows of $1085/ounce on what seems to be a flash crash (see chart from Kitco below). This crash was the result of the People’s Bank of China (PBOC) announcing a less than expected increase in gold reserves. Second, a weakening Chinese stock market is sending a weak signal on commodities. On top of that, the Iran nuclear agreement last week put pressure on the oil price, which in turn has its effect on commodities and precious metals in general. So the outlook for precious metals is all but positive. But there are several anomalies that are interesting to note.

Gold premiums have been moving up at bullion dealers and in particular, silver has had a significant rise in premium, especially junk silver as the chart below shows (Chart created by Correlation Economics). Junk silver premiums are hitting highs of 40%. At the same time, the U.S. Mint halted the sale of silver eagles till August 2015. Gold sales at the U.S. Mint are very strong so far in July 2015.

Additionally, we see that someone is raiding the GLD ETF, just like in 2013. Stock at the GLD trust has hit new lows of 696 tonnes, while managed money shorts have hit new all time highs, indicating a bearish trend in precious metals (Chart created by Correlation Economics).

Investors should mitigate the risks in their gold miners portfolio and we can do that by looking at the costs. In June, 2013, the World Gold Council, an industry group, produced a detailed standard for what miners should include in all-in sustaining costs, or AISC. We will use that metric. If gold prices keep slumping below the all-in sustaining costs of gold production, the company won’t be able to make a profit. That’s why I summarized a table of the most recent AISC numbers of several notable gold mining companies and compared it to the 2013 numbers.

To see the analysis, go here.

An Analysis on the All-in Sustaining Cash Costs of Gold Mines

In June 2013, the World Gold Council (WGC) published a guidance note on the all-in sustaining cash cost metric for gold mining companies. This way, investors can have a better evaluation on the real cost of mining gold. This metric adds additional costs which reflect the varying costs of producing gold over the life-cycle of a mine. To name a few: by-product cash costs, sustaining capital, corporate general and administrative expenses, and exploration costs. We calculate all-in sustaining costs as the sum of total cash costs (net of byproduct credits), sustaining capital expense, corporate, general and administrative expense (net of stock option expense) and exploration expense.

There is one flaw in this system though. These all-in costs only include additional all-in sustaining costs and do not include CAPEX for projects. If we would include these project costs, we would get an astounding $1784/ounce in 2012 for the bigger gold mining companies. Nevertheless, it’s a first step in the right direction.

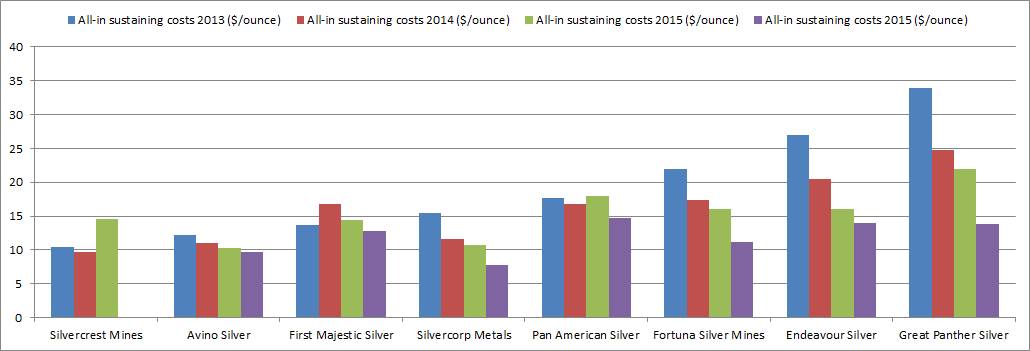
It is interesting to analyze how the all-in sustaining cash costs have progressed in 2013 as compared to 2012. All-in cost data has been taken from a research report of Dundee Capital Markets for the 2012 estimate.

Chart 1: All-in costs gold miners 2012 (Dundee Securities)

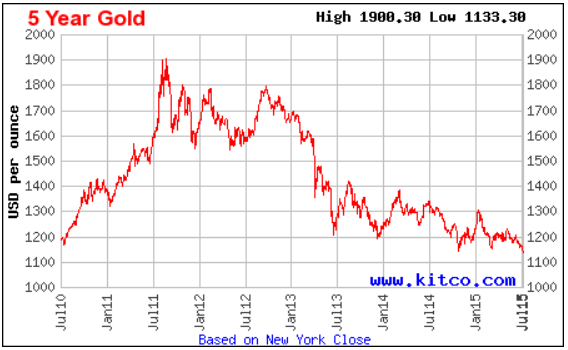
We see here that many gold miners are producing just under the average gold price of $1600/ounce in 2012.

Now we fast-forward to 2013, take data from a recent Denver Gold luncheon for the 2013 AISC cost estimate.

Chart 2: AISC gold miners 2013 (Agnico Eagle)

Again we see that the all-in sustaining costs are hanging just below the current average gold price of $1300/ounce in 2013.

Now let’s compare these numbers year over year. Read on here.

100% Chance of a Major Low in Gold Miners

I don’t know if you have noticed this, but sentiment on the gold miners is at a record low on a 3 year period (because the free chart only goes for 3 years…)

Each time when we see a bottom in sentiment, the gold miners are bottoming out.
I believe the best place to go right now is in gold mining stocks and I’ll put the money where my mouth is, especially when Goldman Sachs tells you to sell your gold.
Some suggestions: ASM, EXK, NEM.

Merger and Acquisition (M&A) activity is growing in silver mining

In a previous article I pointed out how bright the future is for silver. For example, one of my predictions is slowly coming to fruition. Chart 1 shows how the total silver stock (green dots) is starting to decline, indicating signs of increasing silver demand (or decreasing supply). Even the registered silver (blue dots) has started to decline just recently.

Chart 1: CME Silver Stock

The silver price has been forming a base around $US 27/ounce in the latest months (Chart 2).

Chart 2: Silver Price

As a result of this positive development in silver, several mining companies have shown Merger and Acquisition (M&A) activity in the silver sector.

I’ll discuss companies like Pan American Silver Corporation, High River Gold, Liberty Silver Corp., RX gold and silver, U.S. Silver, Vista gold, Endeavour Silver and Kinross Gold.

To read the article go here.