This week, the copper contango remained high, but the copper price fell. So I still expect the copper price to go higher as we move to backwardation. The copper contango theory will not be wrong.
The next step to extend this copper contango theory is to identify the tops and the bottoms of the contango. What are the upper limits of contango and lower limits of the backwardation?
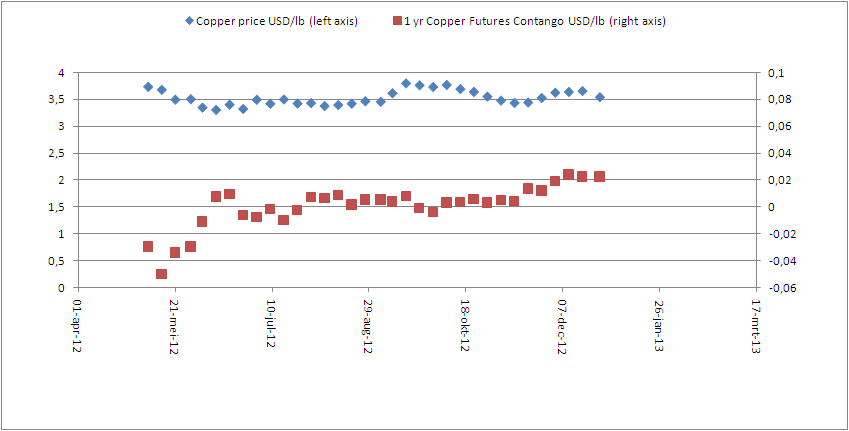 |
| Chart 1a: Copper Contango Vs. Copper Price |
If we quickly look at history, we can see that in 1988, we got a price of $1/lb copper and a backwardation of around $0.2/lb. That’s 20%. If we then look at another data point in 1996, we got a price of $1.25/lb and a backwardation of around $0.1/lb. That’s 8%. Similarly, in 2006 we got 7%. For contango we have 13% in 1982, 7% in 1993, 2% in 2008.
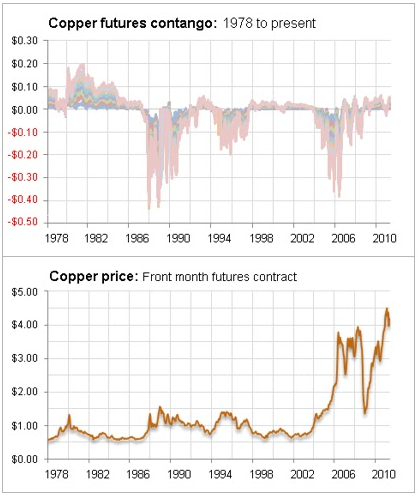 |
| Chart 1b: Historical Copper contango |
There is one caution however, the LME copper stock levels are surging in exchange warehouses, which will put a cap on the rise in copper price and may even bring the copper price down.
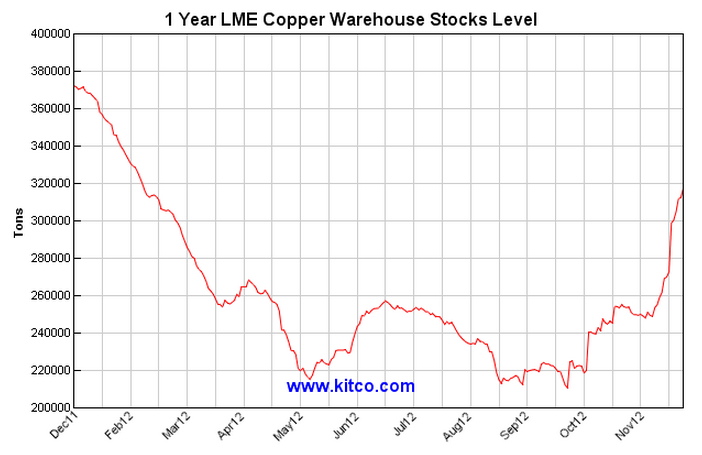 |
| Chart 2: LME Copper Stock |

Copper held at COMEX and LME warehousing is still rising, so the Contango is likely to increase further.When will the trend reverse? Maybe some optimistic PMI figures from China might indicate that inventory is set to fall….
The US Dollar is unlikely to collapse because of capital inflows from China, whose central bank is still buying US T-Bonds in vast quanties, so there isn't an over supply of cash in the system as your analysis suggests.The price of copper seems to be driven by a combination of rising production and weak demand: have a look at this analysis from Barclays Bank: LME Copper inventories and the price of copper. Note that copper at $8,500 per tonne equates to $3.86/lb.