PIIGS Bank Deposits Outflow Accelerating

As I noted a month earlier, Spain’s bank deposits posted an outflow and this outflow is accelerating for the month of May 2013. This time, Italy is posting outflows too.
Greece, Cyprus are of course still in a decline. I expect bail-ins to come if this trend continues. Europeans should be worried about their deposits.

Bank Deposits Update: Spain is in trouble

Time for another bank deposit update for the month of April 2013.

Cyprus continued to have a bank run in deposits, but the most interesting event is that Spain’s deposits are starting to deteriorate too.
Guess where the deposits are going to? Yes, Germany, France, Italy and even Belgium.
That means that money is flowing from the periphery into the center of Europe. I wonder how long this imbalance can continue.

Bank Deposits Update

Remember the Cyprus debacle in March? We were worried about deposits declining.
In February, deposits declined in Cyprus, Ireland, Greece, Portugal. But they increased in Italy and Spain.
In March, we see the same happening again. So I don’t see any significant changes. Maybe the Cyprus crisis was just a little drop in the sea.
Chart 1: Bank Deposits

Bank Reserve Requirements in the Eurozone

Following the crisis in Cyprus of which I talked about here, there has been a question on how much stress the banks can have during a bank run, before their liquidity is at stake.

A typical bank balance sheet looks like this (Figure 1). If the deposits get drained on the right side, the cash gets drained on the left side. The question is, how high is the limit of a drain on deposits?

Figure 1: Balance Sheet
Let’s analyze the bank reserve requirements first. 
Chart 1: Reserve Requirements

Then we look at the capital and reserves of the banks. The capital and reserves are given in the last column (Table 1).

Table 1: Bank Statistics

Correlation: Deposits Vs. LTRO: How to monitor deposits of Eurozone banks

Now that everyone is scared of the bank runs, it is necessary to monitor the deposits at the peripheral countries.

The data is available at the ECB site:

I compiled the data for the most important countries to watch, namely, the PIIGS. And of course Cyprus.

Chart 1: Total Deposits of Peripheral Eurozone Countries

If Cyprus falls, let’s see what will happen to the PIIGS. Probably they will fall too.

I will give a monthly update on this.

I challenge you: do you see a correlation here between deposits and something else?

Yes, it’s the ECB’s LTRO lending to banks (Chart 2). The country that gets the most LTRO will have the most deposits on their banks. That’s because most of the deposits just stay on the balance sheets of the banks. Normally loans should go up, but that’s not the case anymore since 2008. The deposit to loan ratio is going up (Chart 3).

Chart 2: ECB Lending to Banks

Chart 3: Deposit to Loan Ratio U.S. Banks

If all people take their money out of the bank, we get a bank run. Result is that the loans will disappear and go bad. We get an entire collapse in the financial system. So I expect to see LTRO coming back soon as Chart 1 tells us that deposits are again decreasing.

What does Cyprus mean to your money?

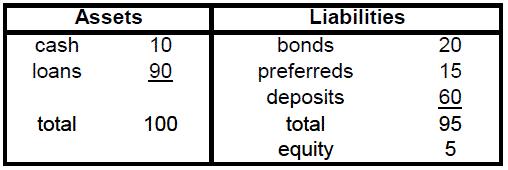
On 15 March 2013, Cyprus said it will impose a levy of 6.75% on deposits of less than 100,000 euros and 9.9% above that. The measure will raise 5.8 billion euros ($7.5 billion), which implies that we have about 68 billion euro ($85 billion) in deposits in the Cypriot banks. What this means is that each depositor in a Cypriot bank will get a haircut on their savings. This event is actually a very important one in history as it marks the first time that depositors actually lose their money, despite the presence of a deposit insurance. Of course, you can’t have deposit insurance without a bailout of the banking system by the IMF. But to have this bailout, depositors need to have a cut (imposed by the IMF). It’s sort of a paradox: “from now on deposit insurance is not insured anymore”.

Many people think that their deposits are safe when they put their cash in the bank, but they either lose it to inflation or in this case lose it to the government. The result is that investors lose confidence in the banking system and will go to assets like precious metals which don’t have counterparty risk.

To read more go here.

Brazil Doubles Gold Holdings in Two Months

Precious metals have been weak for the year of 2012 and investor sentiment is nearing an all time bottom, but I believe we haven’t reached bubble territory yet.

When roaming the precious metals forums, I found out that Brazil doubled its gold holdings in two months time (added 17.2 tonnes in October 2012 and 14.7 tonnes in November 2012. Total holdings now 67.2 tonnes), I just wanted to see if central bank gold buying correlated with the gold price.

And surprisingly, there is a correlation (Charts 1 and 2)! If you look very carefully, you will see that the price of gold goes up when central banks buy gold. For example from 1970 till 1976 we see a net positive buying of gold by central banks. That period was also bullish for the gold price. The same can be said for 1980. Then came a period where central banks slowly got rid of their gold from 1980 till 2002 and that’s a period where gold declined in price. And from 2003 onwards, central banks have slowly shifted from net sellers to net buyers again today.

Keep reading about this analysis here.

The Simplified Bank Stress Test

Bloomberg reported on 20 August 2012 that banks are stepping up their U.S. treasury buying. As deposits increased 3.3% to $US 8.88 trillion in the two months ended July 31 2012, business lending rose 0.7% to $US 7.11 trillion, Federal Reserve data show. This inherently means that banks aren’t lending money to the private sector, but are lending their money to the U.S. government. Peter Schiff pointed this out on the Peter Schiff Show of 20 August 2012. Banks bought $US 136.4 billion in bonds (TLT) already this year, pushing their holdings to $US 1.84 trillion.

Let’s take a snapshot of the debt maturities in 2011 and 2012 and quickly compare them (Chart 1 and  Chart 2: U.S. treasury debt by Year of Maturity (2012) ) (I talked about debt maturities in this article).

Chart 1: U.S. treasury debt by Year of Maturity (2011)
Chart 3: 10 year U.S. treasury yield 

You can immediately see that short term debt has doubled in 1 year time. The biggest buyers of these treasuries were the federal reserve, domestic investors, banks, emerging markets like Japan and China. It’s no wonder that bond yields have gone down with all this buying of U.S. treasuries. But these yields have started to rise sharply just recently, topping 1.85% for the 10 year U.S. treasuries (Chart 3).

If you want to know what impact this will have on the banks, go read the full version of this article.

Banks And Their Exposure to the PIIGS

In the news of today, Spain has been in the center spot of attention. Spanish bond yields have been rising quickly and financials have seen weakness in their share price. In this article I want to see which banks have the most exposure to Spain and to the PIIGS in general.

During the stress tests of July 2011 the exposure of 90 banks to the PIIGS countries’ government debt was released by the European Banking Authority (EBA).

To find out which banks are exposed to the PIIGS and which banks to avoid, please go to my article here:
Analyzing bank exposure to the PIIGS