The May deficit to outlay ratio went to 47%, every number above 40% is hyperinflationary. Now is the time to protect yourself.


China rare earth exports have declined, due to export ban speculation. Exports declined to 3,640 tons last month, down 16% from April and an 18% drop from a year earlier, according to Chinese customs data on Monday.
Rare earth prices have come down to historic levels.

Once in a while I need to post an update on all discovered correlations, we’re getting a huge list already. If I only had some software to get automatic updates of these charts…
Positive correlations mean that if one goes up, the other goes up too. Negative correlations mean that if one goes up, the other goes down.
Positive correlations:
1) Silver premium Vs. Silver Price
2) Baltic Dry Vs. Industrial Commodities
5) Oil Vs. Dow Jones
6) Agriculture Price Vs. Health of Economy
7) Agriculture Vs. Fertilizer Price
8) CRB Index Vs. Commodity prices (oil, agriculture, metals)
10) MZM velocity Vs. 10 year U.S. treasury yield
11) Case-Shiller Index Vs. Housing Market Index
12) Capacity Utilization Vs. Inflation
13) Rhodium Price Vs. Automotive Industry
14) Housing Price Vs. Rise of Wages
15) O-metrix Score Vs. Stock Value
16) Outlay Spending Vs. Hyperinflation
17) Gold Money Index Vs. Gold Price
18) Stock Dividend to Bond Yield ratio Vs. Stock Price
20) Exchange Rate Vs. Treasury Bond Valuation
22) Gold Lease Rate Vs. Gold Price (link2) (link3)
23) Economy of Australia/Canada Vs. Industrial Commodities
24) Jim Sinclair’s Fed Custodials Vs. Gold Price
25) LCNS silver net short positions Vs. Silver Price
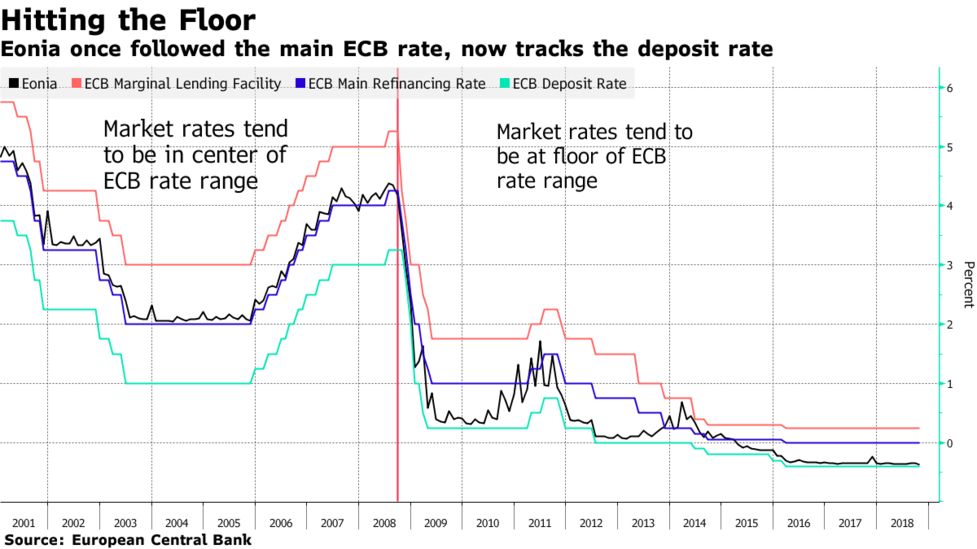
26) ECB Deposit Rate Vs. Euribor and Deposit Facility (Deposit ECB)
27) China Gold Imports from Hong Kong Vs. Gold Price
29) Chinese yoy GDP growth Vs. Chinese yoy Power Consumption (link 2)
30) Chinese yoy Power Consumption Vs. Chinese yoy Power Production
31) M1 and Gold
32) Obesity Vs. Debt
33) Global Equity Prices Vs. Global EPS revisions
34) Total Public Debt Vs. Interest Payment on Debt
35) U.S. Bond Yields Vs. Interest Payment on Debt
36) Federal Reserve Balance Sheet Vs. S&P
37) Federal Reserve Balance Sheet Vs. Gold Price
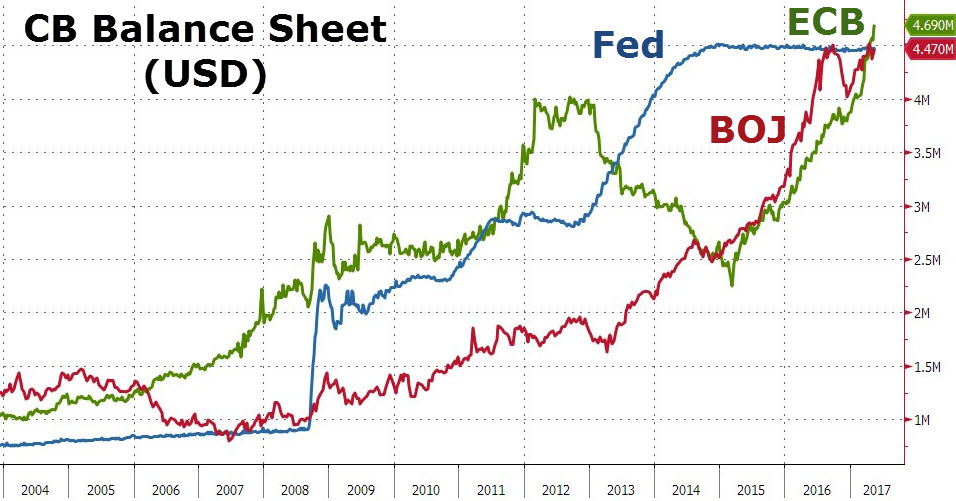
38) Balance Sheet Ratio Fed/ECB Vs. EUR/USD
39) China Manufacturing PMI Vs. Base Metal Prices
40) COMEX stock level Vs. CFTC Open Interest
41) Manufacturing component of Industrial Production Vs. CRB Metals Index
42) Net Short Interest Gold Vs. Gold Price
43) Central Bank Net Gold Buying Vs. Gold Price
44) LCNS silver Vs. Silver Open Interest
45) Bond Yields Vs. Gold Price
46) Gold Miners Bullish Percent Index Vs. GDX
47) Daily Sentiment Index Gold Vs. Gold Price
48) Commercial Net Short Interest Vs. Silver Price
49) Food Stamp Participation Rate Vs. Unemployment Rate
50) Bitcoin Price Vs. Gold Price
51) Credit Expansion Vs. Economic Health (second link)
52) Gold Volatility Vs. Gold Price
53) Total Stock Market Index Vs. GDP
54) Brent Crude Oil Vs. WTI Crude Oil
55) EPS revisions Vs. P/E Ratio
56) Citigroup Surprise Index (CESI) Vs. S&P
58) Dow Theory: Dow Jones Transportation Average Vs. Dow Jones Industrial Average
60) Federal Debt Growth Vs. 10 Year Treasury Yields
61) Fed Funds Rate Vs. 10 Year Treasury Yields
62) Total Central Bank Balance Sheet Vs. Gold Price
63) Large Commercial Short in Copper Vs. Copper Price
64) Bond Yields (<3%) Vs. P/E Ratio
65) ECB Lending (LTRO) Vs. Deposits at Banks
66) Disposable Income Vs. Housing Prices
67) Fixed (conventional) Mortgage Rate Vs. Treasury Yields
68) Adjustable Mortgage Rate Vs. Federal Funds Rate
70) Open Interest Trend Vs. Price Trend
71) Wage Inflation Vs. Consumer Price Index (CPI)
72) Marginal Cost of Gold Suppliers Vs. Gold Price (link 2)
73) Durable Goods Orders Vs. S&P
74) Gold ETF Trust (GLD) Vs. Gold Price
75) PMI (leading indicator) Vs. S&P Revenues
76) Federal Funds Rate Vs. LIBOR Rate
77) Lumber Price (leading indicator) Vs. Housing
78) Building Permits (leading indicator) Vs. Housing
79) Pending Home Sales Vs. Mortgage Applications
80) Employment-Population Ratio Vs. Real GDP per Capita
81) Trade Surplus/Deficit (leading indicator) Vs. Currency Strength/Weakness
82) German Treasury Yields Vs. U.S. Treasury Yields
83) Consumer Sentiment Index (leading indicator) Vs. S&P 500
84) Bitcoin Price Vs. Bitcoin Users
85) Potemkin Rally Vs. Employment to Population Ratio
86) LME Copper Warehouse Stock Level Vs. Copper Contango
87) Art Price (leading indicator) Vs. CPI
88) Total Credit Market Debt Vs. Dow Jones
89) SGE gold deliveries (leading indicator) Vs. China Gold Imports from Hong Kong
90) Retail Sales Vs. Disposable Personal Income Per Capita
91) CRB Index Vs. Emerging Markets
92) Non Farm Payrolls Vs. Job Hires
93) Currency Debasement Vs. High Yielding Assets (Carry Trade)
94) Deposits over Loans: Excess Reserves
95) Food Price (leading indicator) Vs. Potash Price
100) Federal Funds Rate Vs. CPI
101) Full-time Vs. Part-time Workers (Recession)
103) GDP Growth Rate Vs. 10 Year Bond Yield
104) Depletion Curve Vs. Price Movement (silver, oil)
105) Managed Money Long and Short Positions (gold and silver) Vs. Gold and Silver Price (link)
107) Smart Money Flow Index (leading indicator) Vs. Dow Jones
108) Bank Deposits Vs. Deposit Rates
110) Federal Reserve Asset Purchases Vs. Bond Yields
111) Currency Vs. Bonds
112) Retail Sales Vs. Consumer Price Index (CPI)
114) Yen USD/JPY Carry Trade Vs. Gold (link 2)
115) Yen USD/JPY Carry Trade Vs. Stocks
116) Leading/Coincident/Lagging Indicator Vs. Recession
117) Gold per Capita Vs. Income per Capita
118) GLD ETF Stock Vs. Total U.S. ETF gold Stock
119) Gold Repatriation Vs. Recession
120) Dividend Yield Vs. Bond Yield
122) Palm Oil (leading indicator) Vs. Soybean Oil Vs. Crude Oil
123) Junk Bonds Vs. Stock Market
124) Junk Bonds Vs. Energy Junk Bonds Vs. Oil
125) P/E Ratio Vs. M/O Age Ratio
126) Tax Revenues Vs. Stock Markets
127) Employment to Population Ratio (leading indicator) Vs. Wage Growth
128) Equity Valuation Vs. Q Ratio (James Tobin)
130) Working Age Population (15-24) Vs. CPI
131) ISM Manufacturing PMI (leading indicator) Vs. ISM Services PMI
132) Global FX Reserves Vs. Global Equities
133) Corporate Loan Charge-Offs and Delinquencies Vs. Federal Funds Rate (leading indicator)
134) Breadth Advance-Decline Line (leading indicator) Vs. Stocks
136) USD/CNY (leading indicator) Vs. S&P
137) Corporate Profits (leading indicator) Vs. Employment
138) Debt to GDP (leading indicator) Vs. Default Rate
140) GDP Output Gap (leading indicator) Vs. Inflation
141) Yield Curve (leading indicator) Vs. Coincident Indicator
142) GDP (leading indicator) Vs. Oil
143) Credit Risk: LIBOR (leading indicator) Vs. Fed Funds Rate
144) Cross-Asset Correlation Vs. Gold
145) Quits Rate (leading indicator) Vs. Wage Inflation
146) Rig Count (leading indicator) Vs. Oil Production
147) U.S. Dollar Liquidity Vs. Emerging Market Stocks
148) Loan Growth Vs. Interest Rates
149) Copper/Gold Ratio Vs. 10 Year Bond Yield
150) Bond Yields Vs. Unrealized Losses Federal Reserve
151) Trade War Vs. Inflation Vs. GDP
152) Gold/Silver Minus Oil Vs. HUI
153) Silver Depletion Vs. Silver Production
154) Yield Curve Vs. Net Interest Margin
155) PPI (leading indicator) Vs. CPI
156) LIBOR Vs. Jumbo CD
157) Initial Jobless Claims (leading indicator) Vs. Unemployment Rate
158) Yield Curve Vs. Net Interest Margin
159) 3-2 Year Yield (leading indicator) Vs. 2-1 Year Yield
160) Open Interest Vs. Gold Price
161) 2 Year Yield (leading indicator) Vs. Fed Funds Rate
Negative correlations:
1) Copper Price Vs. Copper Futures Contango
2) Interest Rates (bond yields >3%) Vs. P/E ratio of gold mines
3) Non-Farm Payrolls Vs. Unemployment Rate
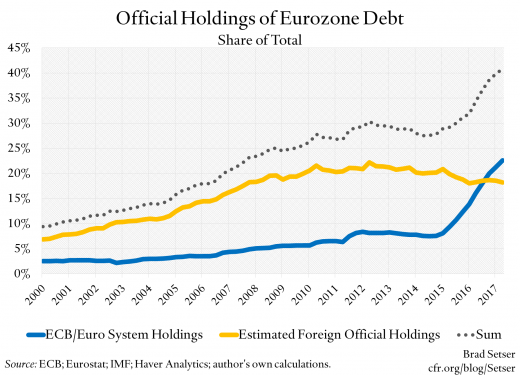
4) Federal Debt Held by Foreigners Vs. U.S. Bond Yields
5) Size of Governments Vs. Their Economies
7) Silver Stock at CME Vs. Silver Price
8) China Reserve Requirements Vs. Shanghai Real Estate Prices
9) Capacity Utilization (leading indicator) Vs. Unemployment Rate
10) Net Commercial Short Positions Vs. Bond Yields (Alternative Site)
11) Net Non-Commercial Long Positions Vs. Bond Yields
12) % Change in Gold Vs. Real Interest Rates on 10 Year Treasuries
13) Shanghai Silver Premium Vs. Silver Price
14) Probability of Recession Vs. 10 year – 3 year Yield Spread (link 2)
15) Junk Silver Premium Vs. Silver Price
16) Wage Inflation Vs. Unemployment Rate
17) Initial Unemployment Claims Vs. S&P
19) GLD Flows Vs. Shanghai Gold Premium
20) Unemployment Rate Vs. Real GDP (leading indicator)
21) Mortgage Rates Vs. Mortgage Applications
22) Single Family Housing Starts Vs. Unemployment Rate
23) Tax Revenue Vs. Personal Savings Rate
24) Change in Non-Farm Payrolls Vs. Change in Unemployment Rate
25) Fed Funds Rate Vs. Unemployment Rate
26) Labor Force Participation Rate Vs. Unemployment Rate
27) M1 Money Supply (leading indicator) Vs. CPI
29) Shanghai Silver Inventory Vs. Shanghai Silver Premium
30) Misery Index Vs. Forward P/E Ratio
31) Flattening Yield Curve Vs. Fed Funds Rate
32) Oil Contango Vs. Oil Price
33) Business Inventory to Sales Ratio (leading indicator) Vs. GDP Growth
34) QE (leading indicator) Vs. Deficit
35) Credit Spread (leading indicator) Vs. S&P
37) Temporary Workers Vs. Recession
38) Stock to Use Ratio Vs. Agriculture Price
39) Help Wanted Online Ads (leading indicator) Vs. Unemployment Rate
40) Federal debt held by foreigners Vs. 10 Year U.S. Yield
41) Economic Policy Uncertainty (leading indicator) Vs. GDP Growth
42) U.S. Treasury Cash Balance Vs. Monetary Base
43) Gold Price Vs. Gold Production
44) Yield Curve (leading indicator) Vs. VIX
45) Copper/Zinc/Lead Production Vs. Silver Price
46) Youth Employment Vs. Initial Jobless Claims
These are a lot of correlations that you need to monitor on a day to day basis!
The 30 year mortgage bond typically follows the BBB rated corporate bond yield.
The 10 year treasury bond typically follows the AAA rated corporate bond yield.
When these diverge from each other (for example in 2008 and in 2015), a recession is likely to occur as people flee from corporate bonds to the safety of treasuries.


